


You watched someone on your feed turn a few hundred dollars into a screenshot worth bragging about, you downloaded a commission-free app, and now you are staring at a screen full of buttons you do not recognize. Buy, sell, market, limit, stop. Which one do you press? And how much of your own money is on the line if you press the wrong one? That gap, between wanting to start trading and actually knowing how, is where most beginners either freeze or, worse, lose money they meant to keep.
Here is the part nobody in those videos mentions: the academic research on retail traders is brutal, with study after study finding that most active day traders lose money over a multi-year horizon. The machinery has only gotten easier to reach, and 2026 made it easier still. The Financial Industry Regulatory Authority (FINRA) scrapped the old pattern-day-trader rule that once forced a $25,000 minimum on small accounts, so the guardrail that used to slow beginners down is gone. The door is wide open now, which means the discipline has to come from you.
This guide is the version of trading for beginners I wish more people got before they funded an account. We will work through it in the order a careful beginner should learn it: what trading actually is versus investing, how to open a brokerage account and which type, the order types that decide your price, the risk rules that keep a small account alive, and how to practice on paper first. Before you risk a dollar, learn the controls.
1. Trading vs. investing: what you are actually signing up for
On the way in, you probably used both words as if they were the same activity at different speeds. They are not. Before you fund anything, your first job is to separate trading from investing cleanly, because the line between them decides your time horizon, your tax bill, and which mistakes are most likely to hurt you. Get this distinction wrong and every choice downstream sits on a cracked foundation: the account, the broker, the order button.
1.1 Trading vs. investing: horizon, intent, and tax treatment
Investing means owning a productive asset and letting it compound, usually for years. You buy a slice of a business or a basket of them, you hold, and if you sell after more than a year the gains qualify for long-term capital-gains rates of 0%, 15%, or 20% depending on your taxable income. Trading means profiting from shorter price moves, anything from seconds to a few months. Hold a position one year or less and the gain is short-term, taxed as ordinary income at 10% to 37%, the same brackets that hit your paycheck.
That tax line is not a footnote. It means a trader starts each year a step behind an investor on identical gross returns, before a single commission or spread enters the picture.
Trading vs. investing on the dimensions that change your decisions
| Dimension | Investing | Trading |
|---|---|---|
| Typical horizon | Years to decades | Seconds to months |
| Primary edge | Compounding, ownership | Timing, price moves |
| Federal tax on gains | Often long-term (0/15/20%) | Often short-term (ordinary 10-37%) |
| Activity / cost drag | Low turnover, low cost | High turnover, higher cost |
| Skill failure mode | Behavioral (panic selling) | Risk and discipline failure |
Read down the columns and one thing should land: most of your money is almost certainly investing money, not trading money. Cash you will need for a house, retirement, or a goal more than five years out belongs in the buy-and-hold column, which is exactly the discipline we walk through in our guide to how to begin with low-cost index funds. Trading money is the small, deliberately separate sleeve you can afford to treat as tuition. When people set out to learn trading and lose money they meant to keep, the root cause is usually that they never drew this line.
1.2 The main trading styles: scalping, day, swing, and position
If trading is the short-horizon game, the next question is how short. The answer sorts traders into four styles, and the practical difference between them comes down to how often you can afford to be wrong.
Trading styles and their practical consequences
| Style | Typical hold | Trades/week | Intraday-margin exposure | Tax tilt |
|---|---|---|---|---|
| Scalping | Seconds-minutes | Very high | High | Short-term |
| Day trading | Intraday, closed by EOD | High | High | Short-term |
| Swing trading | Days to weeks | Moderate | Low-moderate | Short-term |
| Position trading | Weeks to months+ | Low | Low | Mixed, can reach long-term |
Scalping and day trading sit at the punishing end of the dial, because they stack every disadvantage in one place: maximum cost drag from constant turnover, maximum short-term tax because nothing is ever held a year, the most screen time, and the heaviest exposure to a broker’s intraday-margin rules. Swing and position trading move slower, which is gentler on a beginner’s nerves and on the tax bill, and position trades held past a year can even slip into long-term rates. The faster the style, the more often the market gets to test your discipline, and discipline is the one resource a beginner has the least of at the start. Quantitative trading takes this to its logical end, with rules executed by code rather than nerve, but the speed-versus-error trade-off is the same one you are choosing here.
So you have the map of what trading is and how fast it can run. The question that should be nagging at you is the honest one: if I commit money to this, what are my realistic odds?
2. The odds, the myths, and whether trading is just gambling
You would not bet on a coin flip that lands against you four times out of five without knowing the count first. So before any setup advice, you deserve the count. Here we look at what the strongest evidence says about how retail traders actually do, strip out the folklore that circulates on trading forums, then settle the gambling question on its merits, so you carry a realistic expectation into the build phase instead of a hope.
2.1 The uncomfortable odds: what the academic data actually shows
The most reliable evidence here does not come from a broker’s homepage. It comes from academics who studied entire national markets, every trader, for years. A landmark Taiwan study by Barber, Lee, Liu, and Odean tracked the full market and found that more than 80% of day traders lost money in a typical semiannual period, with only a tiny minority persistently profitable net of costs. A Brazilian study by Chague, De-Losso, and Giovannetti went further and followed people who stuck with it: of those who persisted more than 300 trading days, 97% lost money, and only 1.1% earned more than the Brazilian minimum wage.
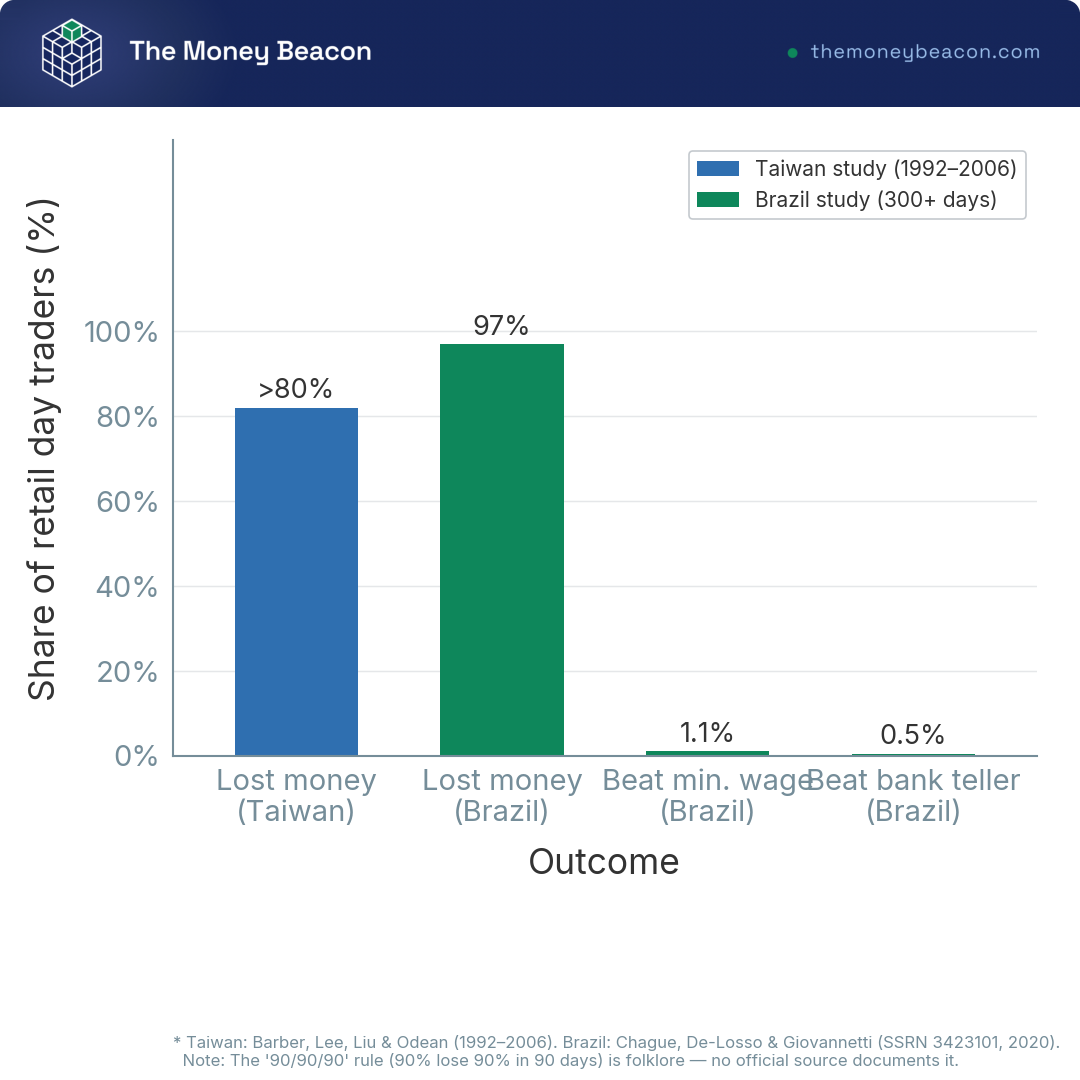
You have probably seen the line “90% of traders lose 90% of their money in 90 days.” It is folklore, not a statistic. No regulator, not FINRA, not the Securities and Exchange Commission (SEC), documents that number, and neither does a universal “97% lose” claim applied to all traders. What the SEC and FINRA education actually says is plainer and harder to wave off: most day traders lose money. Two structural forces explain why. Trading is close to a zero-sum game before costs and a negative-sum one after them, and on the other side of nearly every trade sits a professional or an algorithm with better information, faster execution, and tighter risk control than you have.
The honest framing, then, is not “you will lose” but “most lose.” That single fact is the strongest argument there is for ring-fencing a small sleeve and capping the damage rather than betting the account.
2.2 Is trading the same as gambling?
So if the odds are that grim, is starting to day trade just a slower trip to the casino? Not quite, and the difference is worth being precise about. A casino runs on a fixed house edge that never moves in your favor; play long enough and the math guarantees you lose. Trading has no such fixed edge baked against you, because with genuine risk rules and a real process, a trader can build positive expectancy, where the average outcome tilts your way over many trades.
The catch is the condition attached to that “can.” Strip out the rules, trade frequently, and once costs and short-term taxes are deducted, the activity turns effectively negative-sum, which is gambling with extra steps and a worse tax form. What separates trading from gambling is not the stock or the app or the chart. It is whether you size every position, set a stop, and journal the result, every time, without exception. Do that and you are running a process. Skip it and you are pulling a lever.
That settles the expectation question, and if you are going to do this, you set it up carefully: the account, the broker, and the safety net.
3. Setting up: the right account, broker, and safety net
You have the realistic odds and the rule that turns a gamble into a process. Now comes the doing. Setting up a trading account is a sequence of decisions that have to happen in order, because each one constrains the next. We start with the leverage question, the single most consequential choice you will make here, and work up through the tax wrapper, the broker, the funding, and finally what actually protects your money once it is sitting there.
3.1 Cash vs. margin accounts: leverage, Reg T, and your maximum loss
The first structural fork matters more for a beginner than which broker’s logo you pick, and it is cash account versus margin account. In a cash account, you trade only with settled cash. You cannot borrow, which means you cannot lose more than you deposited, and margin-based day-trading rules never touch you. The one quirk to respect is the Good Faith Violation: because US stocks settle one business day after the trade, selling a position bought with cash that has not fully settled can trip a violation, and three of them within a 12-month period typically triggers a 90-day “settled-cash-only” restriction.
A margin account lets you borrow against your securities. Regulation T sets the initial margin at 50% of the purchase price, and FINRA Rule 4210 sets a maintenance minimum of 25% of market value, with brokers often setting house minimums of 30% to 40%. Margin amplifies gains and losses alike, exposes you to broker day-trading requirements, and opens the door to a margin call, the forced sale of your positions at the worst possible moment.
Cash vs. margin account for a beginner
| Feature | Cash account | Margin account |
|---|---|---|
| Borrowing / leverage | None | Yes (Reg T 50% initial) |
| Max loss | Amount deposited | Can exceed deposit |
| Margin-based day-trading rules apply? | No | Yes (broker intraday-margin rules) |
| Key risk | Good Faith Violations | Margin calls, forced liquidation |
| Beginner verdict | Default starting point | Only after experience |
The rule here is simple, so we will state it plainly: open a cash account first. It caps your loss at what you put in and sidesteps margin-based day-trading rules entirely. Margin is a tool you can grow into later, not a default to auto-enable on day one just because the app offered it.
3.2 Account vs. asset class: where you trade vs. what you hold
One mix-up traps almost every beginner. People ask whether they should pick “a Roth IRA or an ETF,” and the question has no answer because the two are not on the same shelf. An account, a taxable brokerage, a traditional individual retirement account (IRA), a Roth IRA, a 401(k), or an HSA, is a tax wrapper. A stock, an exchange-traded fund (ETF), an index fund, an option, or a bond is what you hold inside that wrapper. You hold an ETF inside a Roth IRA. Sort that out and the wrapper decision becomes a clean choice about taxes, not a false either-or.
If you want to weigh the wrappers side by side beyond what we cover here, our guide to comparing the brokerage accounts themselves lays out the full set.
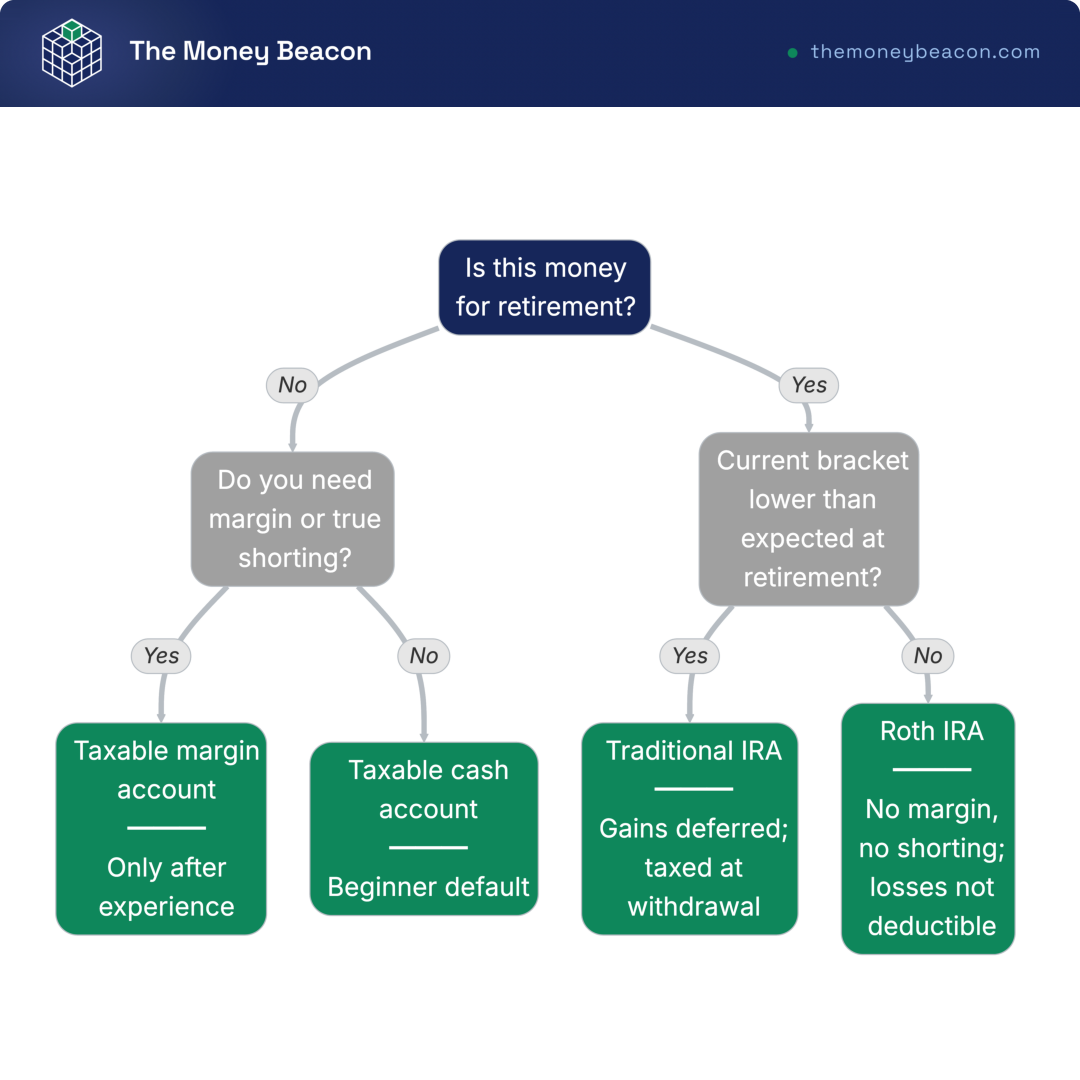
3.3 Taxable brokerage vs. IRA: can I trade inside a Roth?
So which wrapper should your trading sleeve live in? For most beginners the real contest is among three: the taxable brokerage account, the traditional IRA, and the Roth IRA.
Where to trade: account wrappers compared (accounts, not asset classes)
| Account | 2026 contribution limit | Tax on gains inside | Withdrawal flexibility | Trading notes |
|---|---|---|---|---|
| Taxable brokerage | None | Taxed yearly (ST/LT) | Anytime | Wash-sale rule applies; 1099-B issued |
| Traditional IRA | $7,500 (+$1,100 age 50+) | Deferred; ordinary income at withdrawal | Penalty before 59½ | No margin; no shorting |
| Roth IRA | $7,500 (+$1,100 age 50+) | Tax-free if qualified | Contributions out anytime; gains restricted | No margin; no shorting |
Data current as of June 2026.
The appeal of trading inside an IRA is genuine: gains are not taxed each time you sell, so the short-term-tax drag disappears and the wash-sale headache largely vanishes within the account. But the trade-off is real money in the other direction. An IRA allows no margin and no true shorting, contributions are capped at $7,500 for 2026 plus a $1,100 catch-up once you turn 50, and a loss inside an IRA is not deductible, it is simply gone. That last point is where beginners get hurt. Running a high-turnover strategy inside a Roth is a bet that you will be right, and if you are wrong, you have burned irreplaceable tax-advantaged room you can never get back. A small learning sleeve in a Roth can make sense; betting the contribution room on it does not.
If the money in question is genuinely earmarked for decades out, the wrapper conversation widens into our guide to longer-term retirement saving rather than a trading sleeve at all.
3.4 Choosing a broker on the dimensions a beginner feels
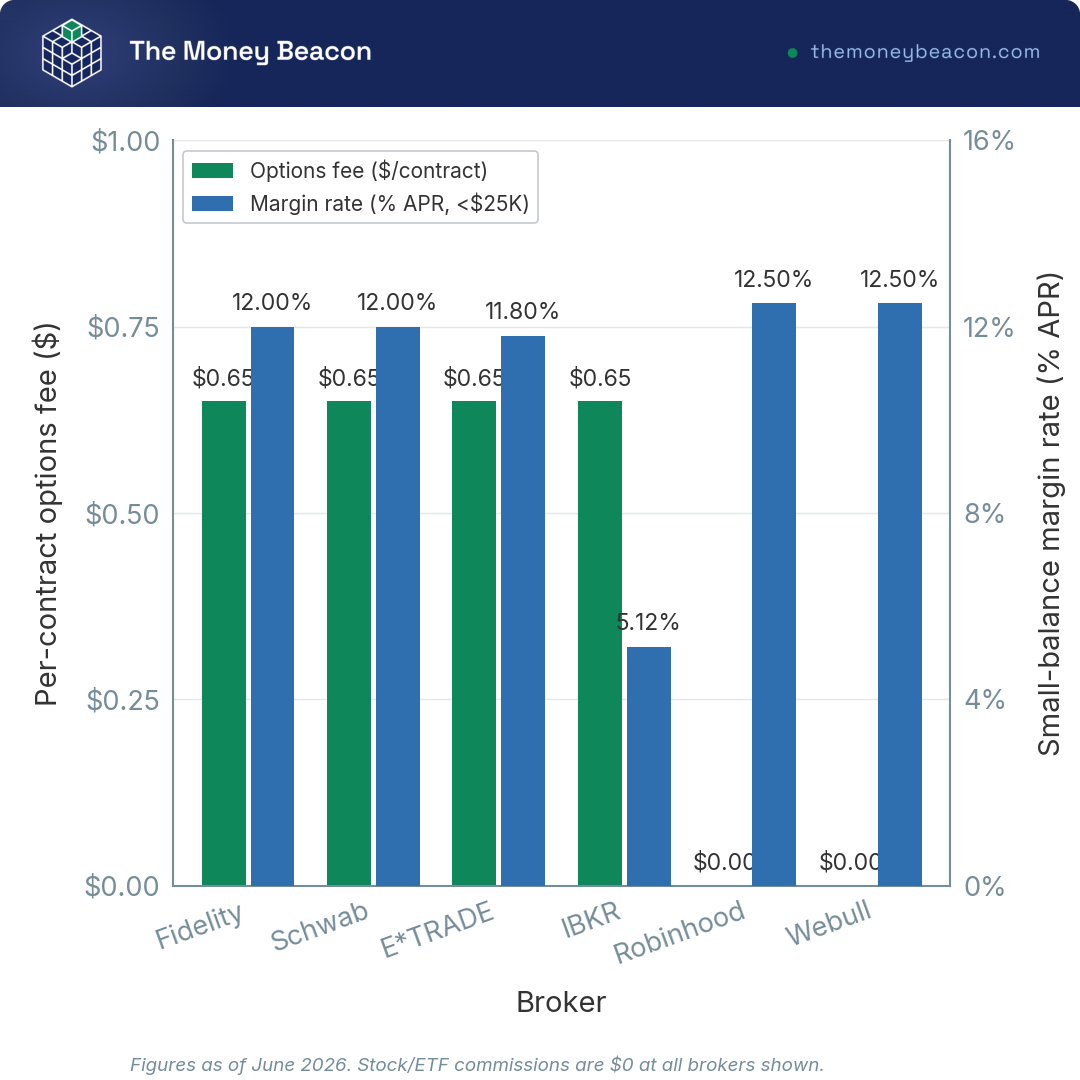
With the wrapper settled, the broker choice gets easier than the marketing suggests, because the headline number is identical almost everywhere. US stock and ETF commissions are broadly $0, which means the real differences hide in the options fee, the margin rate, and the platform.
Major US brokers on the dimensions a beginner feels
| Broker | Stock/ETF commission | Options per contract | Fractional shares | Paper trading | Notes |
|---|---|---|---|---|---|
| Fidelity | $0 | $0.65 | Yes | Limited | Strong research |
| Charles Schwab | $0 | $0.65 | Yes (Schwab Stock Slices) | thinkorswim (paperMoney) | Absorbed TD Ameritrade/thinkorswim |
| Robinhood | $0 | $0 | Yes | Yes (recent) | PFOF model; simple app |
| E*TRADE (Morgan Stanley) | $0 | $0.65 (tiered lower for active) | Yes | Power E*TRADE | Owned by Morgan Stanley |
| Interactive Brokers | $0 (Lite) / tiered | $0.65 or lower tiers | Yes | Yes | Lowest margin rates; pro tools |
| Webull | $0 | $0 | Yes | Yes | Active-trader app |
| TastyTrade | $0 (stocks) | low, capped per leg | Yes | Yes | Options-focused |
Data current as of June 2026.
So match the broker to the activity you actually plan to do, not to the one with the cleanest app. If you trade options, the per-contract fee and the platform tools dominate, and you will notice that Robinhood and Webull advertise $0 per contract while the traditional brokers charge about $0.65. If you will ever borrow, margin rates matter, and on a small balance under $25,000 they run roughly 11.8% to 12.5% at the major brokers, with Interactive Brokers commonly the cheapest at around 5.12% on its Pro tier.
Tom’s take

I’ve shopped most of the big private banks and made them compete on terms, and the lesson carries straight down to a retail brokerage: nobody leads with their best number. The $0 commission is a flat headline, so the differences you actually pay for, options fees, margin rates, routing, are the ones you have to go dig out yourself.
If a simple, app-first experience is what you are after for a first account, our review of Robinhood walks through where that model helps and where it costs you.
3.5 Opening and funding step by step: ACH, wire, ACAT, and T+1
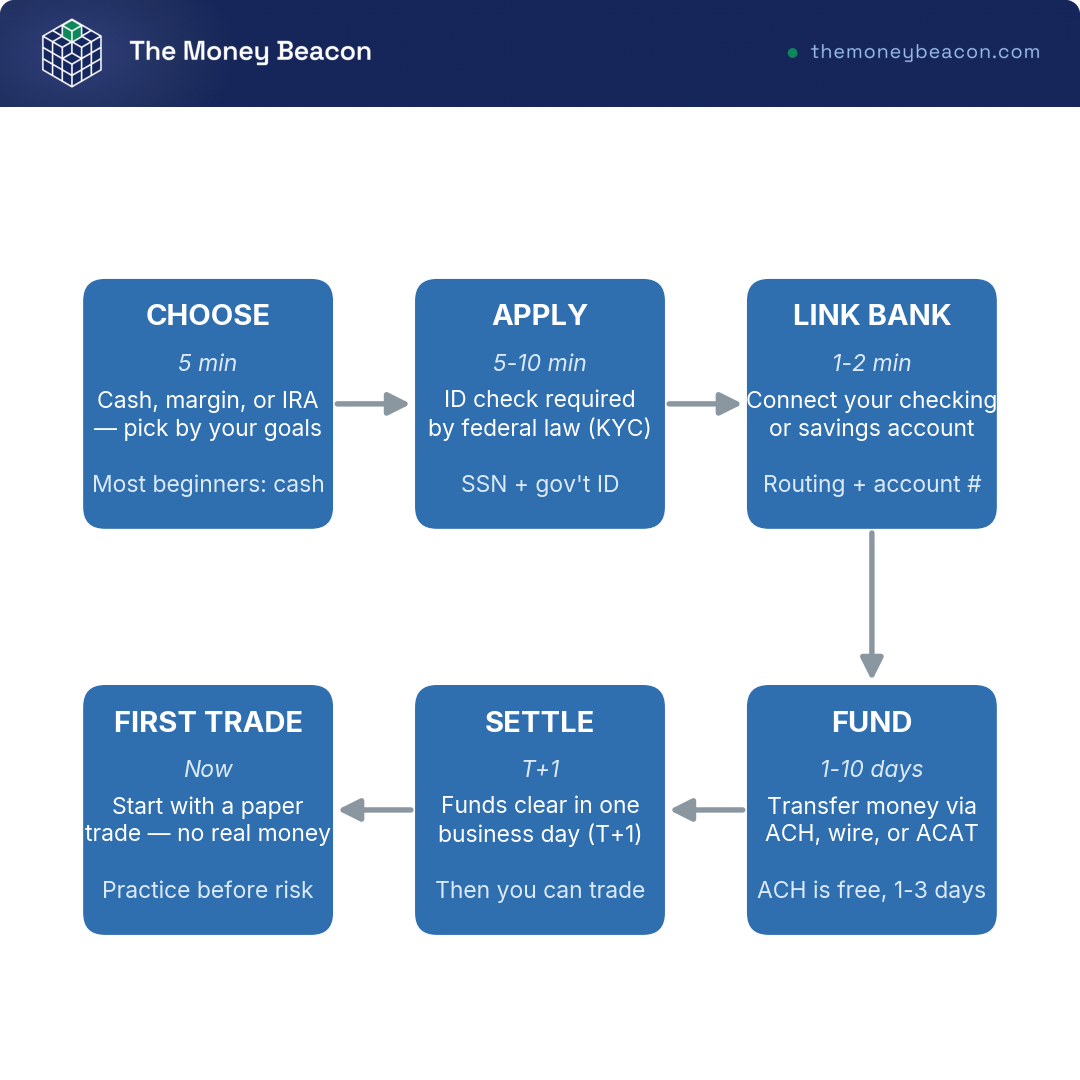
The wrapper question is sorted and the broker is chosen, so what does actually opening and funding the account look like, start to finish? The flow is linear and standardized, because brokers must verify your identity under federal customer-identification rules: you choose the account type, apply and verify your identity, link a bank, fund it, wait for the cash to settle into buying power, then place your first trade.
How you fund it changes how fast you can act. An ACH transfer is the common default, free and usually clearing in one to three business days, often with instant buying power up front. A wire is the fastest route for a large sum, typically same or next business day, though it can cost up to about $30 outgoing. An ACAT transfer moves existing positions in-kind from another broker and takes roughly six to ten business days, sometimes with a transfer-out fee up to about $75 at the old broker. A check or mobile deposit is the slowest of the bunch.
Once you start trading, settlement governs your pace. US equities settle T+1, one business day after the trade, since the SEC shortened the cycle in May 2024. In a cash account that is what decides when your proceeds become reusable, so plan your funding before you want to trade, not the morning of.
3.6 SIPC is not FDIC: what actually protects your money
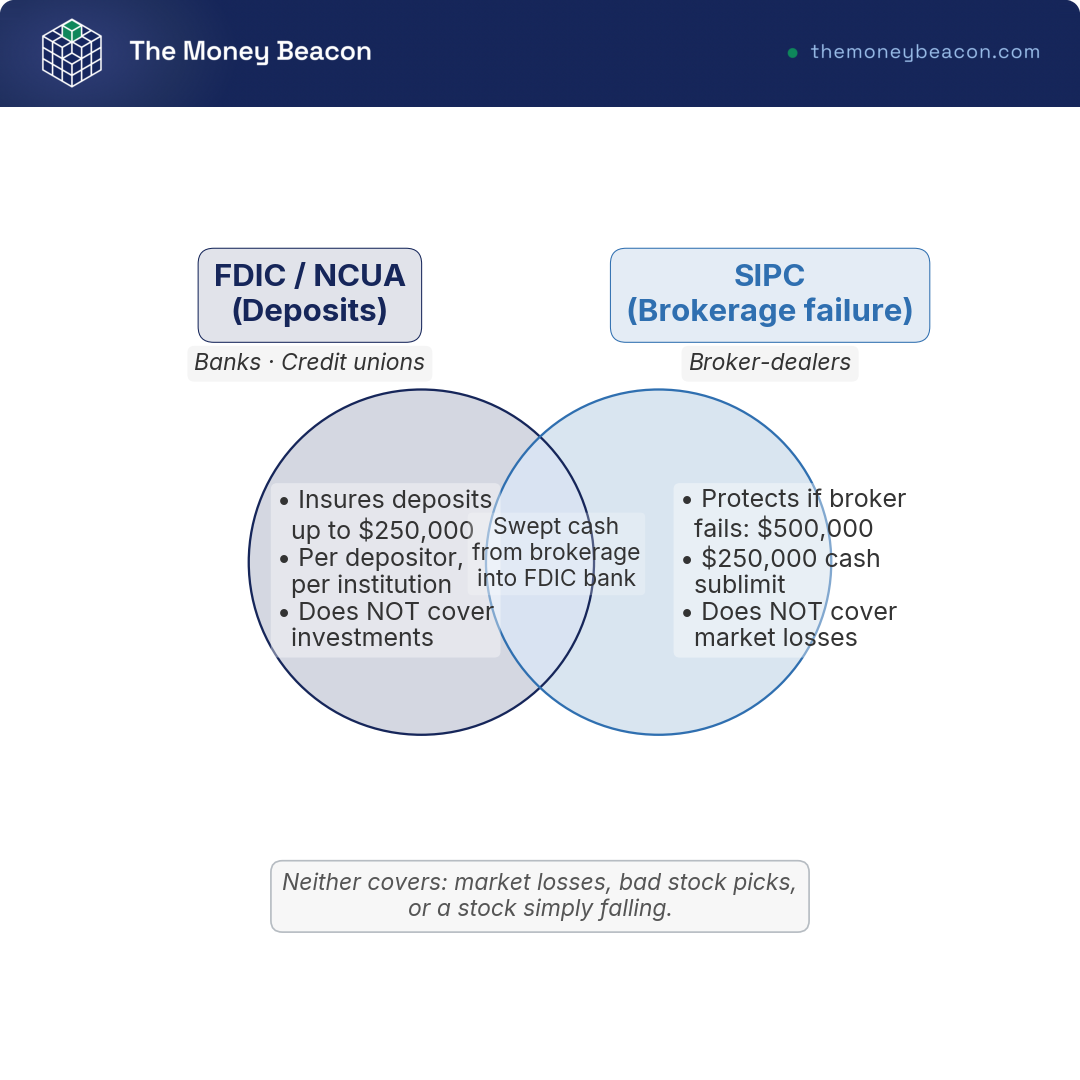
The most common safety confusion happens right here, the day money hits a brokerage, and it is worth getting straight before you fund. People assume their brokerage balance is insured by the Federal Deposit Insurance Corporation (FDIC) the way their checking account is. It is not, and the distinction matters the day something goes wrong.
FDIC vs. NCUA vs. SIPC (what protects what)
| Protection | Covers | Limit | Does NOT cover |
|---|---|---|---|
| FDIC | Bank deposits | $250,000 per depositor/category | Investments, market loss |
| NCUA | Credit-union deposits | $250,000 per member/category | Investments, market loss |
| SIPC | Brokerage failure (missing securities/cash) | $500,000 total; $250,000 cash | Market losses, bad picks |
FDIC and the National Credit Union Administration (NCUA) insure deposits, up to $250,000 per depositor, per institution, and they cover banks and credit unions, not investments. SIPC is the brokerage equivalent, protecting customers up to $500,000 per customer including a $250,000 cash sublimit if the broker-dealer fails and assets go missing. There is one area of overlap worth knowing: some brokers sweep your uninvested cash into FDIC-insured partner banks, so that swept cash can carry pass-through FDIC insurance, while the securities themselves stay SIPC-only.
Here is the line that matters most, and it is a warning, not a reassurance. None of these insurances covers a market loss. SIPC protects you if your broker collapses; it does nothing if your stock simply falls.
The account is open, funded, and you know exactly what protects it and what does not. What no insurance and no setup can do is press the buttons for you. Now you face the screen and a row of order-type controls, buy, sell, market, limit, stop, and learning what each one actually does is where the real discipline starts.
4. Order types: the controls every trader must master
You are staring at the order ticket now, with its row of buttons (buy, sell, market, limit, stop) and a dropdown that probably means nothing to you yet. This is where setup turns into action, and where most beginners make their first avoidable mistake by tapping the loudest button. Before any real money moves, you owe yourself a clear picture of what each control actually guarantees, where the stop versus stop-limit trap waits, and what one disciplined trade looks like start to finish.
4.1 Market, limit, stop, and stop-limit: what each guarantees
The four order types you will use again and again each trade away one thing to protect another, and knowing the trade is the whole point. A market order executes immediately at the best available price, so it guarantees you get filled but says nothing about the price you pay. In a liquid, large-cap name during regular hours that gap is usually trivial; in a thin stock or after hours, the fill can land well off the quote, the slippage that quietly eats beginners alive. A limit order flips the guarantee around: you set the worst price you will accept, a buy fills at your limit or lower, a sell at your limit or higher, so you control the price but the trade may simply never happen if the market never reaches you.
The two stop orders sit on top of those. A plain stop (a stop-loss) is dormant until the price touches your trigger, at which point it turns into a market order, so it fills reliably but at whatever price the market offers once it is live. A stop-limit turns into a limit order at the trigger instead, so it protects your price but can leave you holding a falling position if the market jumps past your limit.
Order types: control, guarantee, and beginner use case
| Order type | Guarantees | Does not guarantee | Best beginner use |
|---|---|---|---|
| Market | Execution | Price (slippage risk) | Highly liquid stocks only |
| Limit | Price | Execution | Default for most entries |
| Stop (stop-loss) | Triggers at stop | Fill price (becomes market) | Capping downside |
| Stop-limit | Triggers + price | Execution after trigger | Avoiding bad-gap fills |
For nearly every entry you place as a beginner, the limit order is the safe default, because it stops you from overpaying in a fast or thin market and the cost of an occasional missed fill is just a trade you did not need. Save the market order for genuinely liquid names where the spread is a penny or two and getting in matters more than shaving it.
4.2 Stop vs. stop-limit: the difference that bites in a fast market
That distinction between the two stops sounds academic until the market gaps, and then it decides whether you are out of a losing trade or stuck in it.
So the decision really comes down to which fear is larger. If your priority is certainty that you are out, use a plain stop-loss and accept an uncertain price in a gap. If avoiding an ugly gap fill matters more to you than a guaranteed exit, use a stop-limit and accept that it may leave you in the trade. For most beginners capping a real downside, the plain stop-loss is the more honest tool, because the worst outcome it allows, a slightly worse price, is survivable, while the worst outcome a stop-limit allows is no exit at all.
4.3 A worked example: placing your first disciplined trade
Definitions stick once you watch them run as a single sequence, so let’s walk one full trade with real numbers. Picture a $3,000 cash account and a stock trading at $50.00, with a bid of $49.98 and an ask of $50.02. You decide to buy 10 shares and, following the rule we are about to formalize, to risk no more than 2% of the account, which is $60, on the position.
Here is the trade, button by button. You enter with a limit order at $50.02 rather than a market order, so you know your fill, and 10 shares cost roughly $500 of your $3,000. With $60 of risk spread across 10 shares, that is $6 of risk per share, so you set a stop-loss at $44.00 ($50 minus $6), the price at which you accept the trade is wrong and get out. For the upside you want winners larger than losers, so you place a sell limit at $62, a 2:1 target ($12 of reward against $6 of risk per share). Then you log it. The commission on all of this is $0 at most brokers, so the only real cost is the roughly $0.04 spread per share, the gap between the $50.02 you pay and the $49.98 you would get back if you turned around and sold.
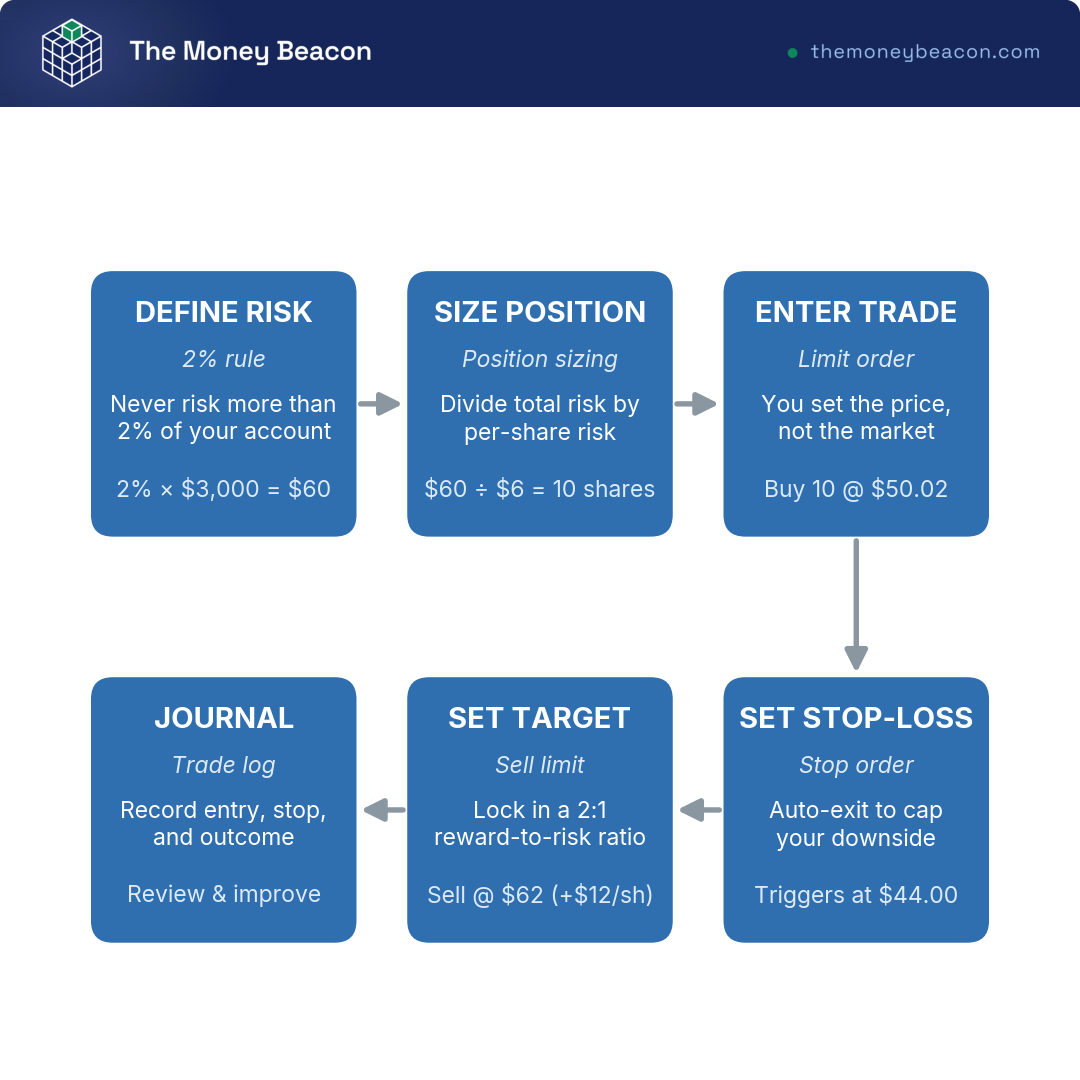
For now, the open question is the one the 2% and the 10 shares glossed over: where did those numbers come from?
5. Risk management: the math that keeps a small account alive
The worked trade quietly leaned on a rule it never explained: why 2%, why 10 shares, why a stop at $44 and not $40. That rule is position sizing, the single most important skill a beginner controls. So let’s start from the sizing math that keeps a small account solvent, layer in the risk-reward logic that lets you profit while losing most of your trades, then update the day-trading rulebook for 2026, where the number you have probably heard quoted no longer exists.
5.1 Position sizing and the 1%-2% rule
The foundational rule is one line: risk no more than 1% to 2% of your account equity on any single trade. The word that does the work is “risk.” It does not mean the dollars you deploy into the position; it means the dollars you lose if your stop is hit. On a $5,000 account, 1% is $50 of risk per trade, and that $50 ceiling, not a gut feeling about how good the setup looks, is what sets your position size.
The size falls out of a simple formula once you know your entry and your stop:
Shares = (Account x Risk%) / (Entry – Stop price)
Run it on a $5,000 account risking 1%, so $50. Buy at $20 with a stop at $18, a $2 risk per share, and you can hold 25 shares, a $500 position. Notice the split: the position is $500, but the dollars actually at risk are $50, because $18 is as low as you let it go.
Position sizing at 1% risk on a $5,000 account
| Entry | Stop | Risk/share | Risk budget (1%) | Shares | Position size |
|---|---|---|---|---|---|
| $20 | $18 | $2.00 | $50 | 25 | $500 |
| $50 | $47 | $3.00 | $50 | 16 | $800 |
| $100 | $95 | $5.00 | $50 | 10 | $1,000 |
Read across any row and the position size changes while the risk budget never does, which is the entire discipline in one table: the stop sets the size, not the other way around. The reason this matters so much is survival arithmetic. At 1% or 2% per trade, a normal losing streak bruises the account; at 5% or 10% per trade, the same streak can march it toward zero, because each loss is taken from a smaller base than the one before. The simulated equity curves below make the collapse visible, and they are the strongest argument there is for sizing small.
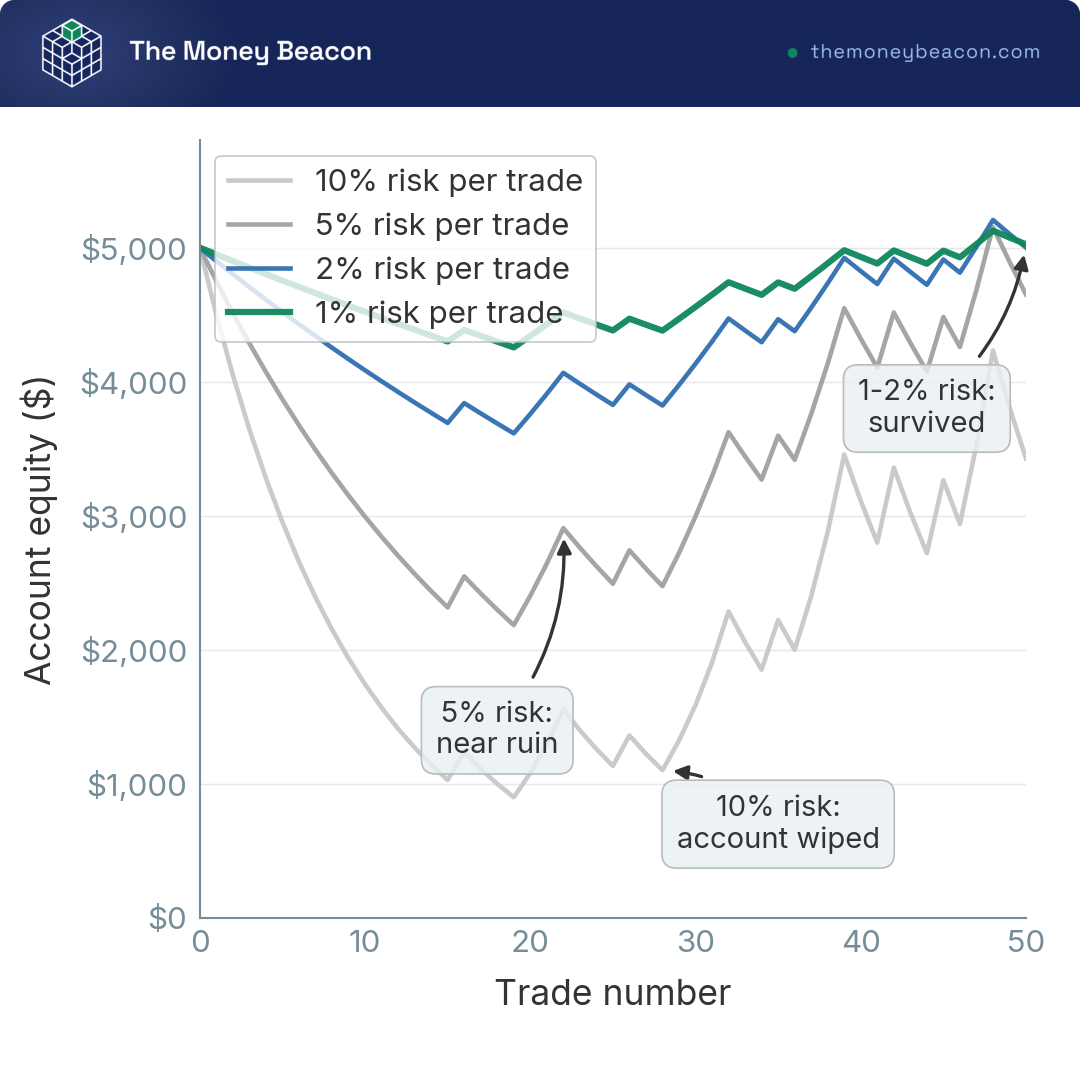
The same fixed-fraction logic governs anything volatile you might be tempted to trade, which is why the rule travels to a crypto position just as cleanly as to a stock, only with a wider stop to match the wider swings.
5.2 Risk-reward ratios and why win rate is not everything
Sizing tells you how much to lose when you are wrong; risk-reward tells you why being wrong often can still leave you ahead. The math is friendlier than instinct suggests. With a 1:1 reward-to-risk ratio, where your target and your stop are the same distance away, you need to win about 50% of the time just to break even before costs. Stretch the target so the reward is 1.5 times the risk and the breakeven win rate drops to about 40%; at 2:1 it falls to about 33%, and at 3:1 to about 25%. In plain terms, with the 2:1 target from the worked trade, you can be wrong two times out of three and still break even before costs, because the one winner pays for the two losers.
That reframes the whole game away from being right and toward being asymmetric. A 90% win rate sounds like mastery, but if the occasional loss is catastrophic, it is a losing system, while a 35% win rate with disciplined 2:1 or 3:1 winners can quietly compound. The catch sits in those three words, “before costs and taxes,” because the spread and the short-term tax bill push every one of those breakeven rates higher in real life, which is exactly the drag the next part puts numbers on.
5.3 Day-trading rules in 2026: the PDT $25,000 threshold is gone
If you have read anything about day trading, you have met the $25,000 number, and you need to know it no longer works the way the internet still says it does. For years the pattern-day-trader (PDT) rule flagged a margin account that placed 4 or more day trades within 5 business days (when those trades topped 6% of total trades) and forced it to hold at least $25,000 in equity, below which day trading was restricted. That was a hard federal-style bright line, and it shaped how every small account approached intraday trading.
That regime is over. Under FINRA Regulatory Notice 26-10, FINRA’s amended intraday-margin requirements took effect June 4, 2026 and eliminated the pattern-day-trader designation tied to counting trades, along with the standalone $25,000 minimum-equity trigger, with a transition period running through October 20, 2027. Here is the part that matters most, because it is easy to misread as good news: the disappearance of the federal line does not mean no rule. Day-trading limits now flow from FINRA’s broader intraday-margin requirements and, in practice, from each broker’s own day-trading and buying-power policy, which can be stricter or looser than the old number. So “there is no $25,000 rule anymore” is true, and “I can day trade freely in any margin account” is false; you confirm the policy at your specific broker rather than assume.
Day-trading rule decision points (2026)
| Situation | Margin-based day-trading rules apply? | Practical move |
|---|---|---|
| Cash account, any frequency | No | Watch T+1 / GFV |
| Margin, occasional day trades | Broker intraday-margin rules may apply | Confirm broker’s day-trading policy |
| Margin, frequent day trades, small balance | Yes; broker buying-power limits likely | Check the broker’s equity/buying-power rules |
| Margin, larger balance | Yes; broker intraday-margin rules | Maintain a comfortable equity cushion |
The old federal $25,000 pattern-day-trader threshold was removed by FINRA effective June 4, 2026 (transition through October 20, 2027); day-trading constraints are now driven by broker intraday-margin policy. Data current as of June 2026.
Read down the first column and the cleanest escape is the one you already set up in section 1: a cash account sidesteps margin-based day-trading rules entirely, at any frequency. The price of that route is the settlement mechanics we covered, T+1 and the Good Faith Violation rules.
Hank’s take
follow how regulators move and you notice that a rule this old rarely vanishes cleanly; the bright-line $25,000 is gone, but the risk it was meant to police did not, so it gets re-priced into each broker’s own margin policy. The number changed, the thing it was guarding against did not.
6. Practice first: paper trading, a written plan, and a journal
You now have the controls and the sizing math, which is everything you need to place a disciplined trade except the one thing no formula supplies: the nerve to follow your own rules when real money is moving. The way you build that nerve cheaply is to rehearse before you risk a cent. So we start with what simulated trading does and does not teach, build the written plan and journal that make the rehearsal mean something, then set a four-check gate so the jump to real money is a decision rather than an impulse.
6.1 Is paper trading worth it, and how to build a plan and journal
Paper trading is placing simulated trades with fake money against a live or delayed market feed, and for a beginner it is genuinely worth the time, with one honest caveat. It teaches you the platform mechanics, the order types, and whether you can actually follow a plan, all at zero financial risk. What it cannot teach is emotion, because fake money does not trigger fear or greed, and it tends to assume perfect fills with no slippage. So treat it as a mechanics-and-discipline rehearsal, not a profit forecast, and run 20 to 40 simulated trades on a written plan before you commit real cash. Free simulators are everywhere: Schwab’s thinkorswim paperMoney is the most directly confirmed for 2026, with Power E*TRADE and the simulators at Interactive Brokers, Webull, and TastyTrade also widely available, so verify the one on your broker’s platform.
The rehearsal only makes sense if it tests something written down. A trading plan fits on one page and specifies five things: what you trade (the instruments), when you enter (the setup that triggers a trade), where you exit (the stop and the target), how much you risk (the 1% to 2% from the last section), and when you stop for the day (a fixed daily loss limit that ends the session). Alongside it, a journal logs every trade so the rehearsal produces lessons instead of just outcomes. At a minimum, record the date and instrument, the entry, exit, and size, the planned stop and target, the reason you took the trade, and the result with the lesson. The reason column is the one beginners skip and the one that matters most, because it is what separates a setup that works from a win you got lucky on, and a weekly read through the journal is where you catch yourself quietly moving stops or chasing.
6.2 The limits of paper trading: are you ready for real money?
The honest limit of all this rehearsal is that the bridge from paper to live is not a bigger simulator or more practice trades, it is the smallest possible real position, even a single share. That way the fear and the urge to override your stop appear while the money at risk stays trivial, which is the cheapest way to meet your own psychology.
Before you size up from that first tiny trade, run yourself through a four-check gate, and treat any single “no” as a signal to keep practicing rather than push ahead. First, have you placed at least 20 paper trades following a written plan, not just clicked around a simulator? Second, did you honor every stop, or did you talk yourself out of a few? Third, is this genuinely discretionary money, sitting on top of a funded emergency fund, that you can afford to lose? Fourth, are you starting at minimum size, not the size that would “make it worthwhile”? All four yes, and you can place a small live trade with your eyes open. Any no, and the rehearsal simply is not finished.
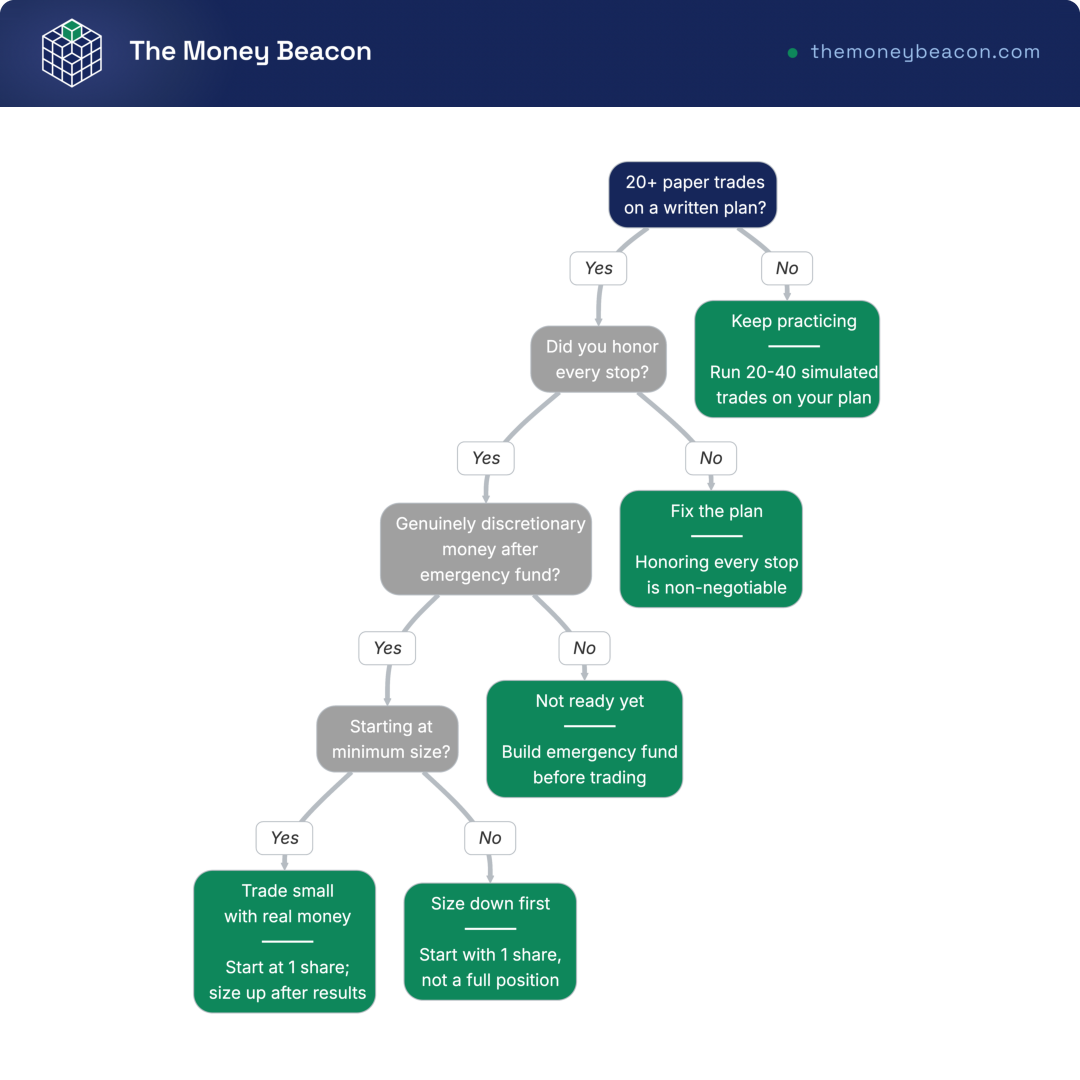
Clear those four checks and you can now do the whole job: open a properly sized, fully planned trade and rehearse it until the mechanics are second nature. What you still cannot see from here is what you actually keep once the trade closes, and that is the arithmetic the next part settles.
7. Costs and taxes: what frequent trading really keeps you
The commission line reads $0 at almost every broker now, which fools a beginner into thinking trading is free. It isn’t. Several costs survive the death of the commission, and then a tax form at year-end decides how much of whatever you make you actually get to keep. So let’s start with the costs that outlive $0 commissions, work through how the IRS taxes a gain by holding period, untangle the wash-sale rule that punishes hasty loss harvesting, and finish with one year of the same $10,000 run two ways, so the drag stops being a warning and becomes a number.
7.1 The real costs of trading beyond $0 commission
Free trading is a headline, not a fact. The largest hidden cost is the bid-ask spread, the gap between the ask you buy at and the bid you sell at. On a liquid large-cap stock the spread is a penny or two; on a thin name it can eat a real fraction of your edge, and you pay it on the way in and again on the way out. Sitting right beside it is slippage, the difference between the price you expected and the price you actually got, which widens in fast or thinly traded markets and in extended hours. The fix for both is the same discipline from the order-types section: trade liquid names and use limit orders rather than market orders when the book is thin.
Three smaller costs round out the menu. Options carry a per-contract fee, $0 at Robinhood and Webull and about $0.65 at the traditional brokers, so an active options trader feels it where a stock trader does not. Margin interest is the one that genuinely hurts, running roughly 11.8% to 12.5% on a small balance under $25,000 at the major brokers, which is why borrowing to trade a small account is close to a self-inflicted wound. Last are the regulatory pass-through fees, the SEC and FINRA charges that amount to fractions of a cent per share or contract, unavoidable and, for a beginner, negligible.
The real costs of trading (beyond $0 commission)
| Cost | Who charges | Rough magnitude | How to reduce |
|---|---|---|---|
| Bid-ask spread | Market | Pennies to dollars/share | Trade liquid names; use limits |
| Slippage | Market | Varies; worse off-hours | Avoid market orders in thin markets |
| Options contract fee | Broker | $0-$0.65/contract | Compare brokers |
| Margin interest | Broker | ~11.8%-12.5% small balances | Avoid margin |
| Regulatory fees | SEC/FINRA | Fractions of a cent per share/contract | Unavoidable, minor |
Data current as of June 2026.
None of these alone looks fatal, which is exactly the trap. Stack a two-cent spread, a touch of slippage, and a per-contract fee across dozens of trades a month and the drag compounds quietly against you, all before the IRS takes its turn. The spread was the first cost; the tax form is the second, and it is the bigger one.
7.2 How are my trading profits taxed? Short-term vs. long-term
The single fact that separates a trader’s tax bill from an investor’s is holding period. Hold a position one year or less and the gain is short-term, taxed as ordinary income at your 10% to 37% bracket, the same rates that hit your paycheck. Hold it more than a year and the gain turns long-term, taxed at 0%, 15%, or 20% depending on your taxable income. For 2026, a single filer pays 0% on long-term gains up to $49,450, 15% from there to $545,500, and 20% above that; married filing jointly pays 0% up to $98,900, 15% to $613,700, and 20% above. Because a trader, by definition, sells inside a year, almost every trading gain lands in the higher ordinary column.
Then there’s a layer most beginners never see coming. The Net Investment Income Tax (NIIT) adds 3.8% on top of your investment income once your modified adjusted gross income clears $200,000 single or $250,000 married filing jointly, thresholds that aren’t indexed to inflation, so more people drift over them each year. NIIT stacks on the capital-gains rate rather than replacing it, which is how the top long-term rate reaches 23.8%. When April comes, the broker hands you a 1099-B summarizing your proceeds and basis, and you report each trade on Form 8949 and total it on Schedule D.
Capital-gains and income tax on trading outcomes (2026 federal)
| Item | Holding period | Federal rate |
|---|---|---|
| Short-term capital gain | ≤ 1 year | Ordinary 10%-37% |
| Long-term capital gain | > 1 year | 0% / 15% / 20% |
| NIIT (high earners) | Any | +3.8% above MAGI thresholds |
| Qualified dividend | Meets holding test | 0% / 15% / 20% |
| Ordinary dividend / interest | n/a | Ordinary 10%-37% |
Data current as of June 2026.
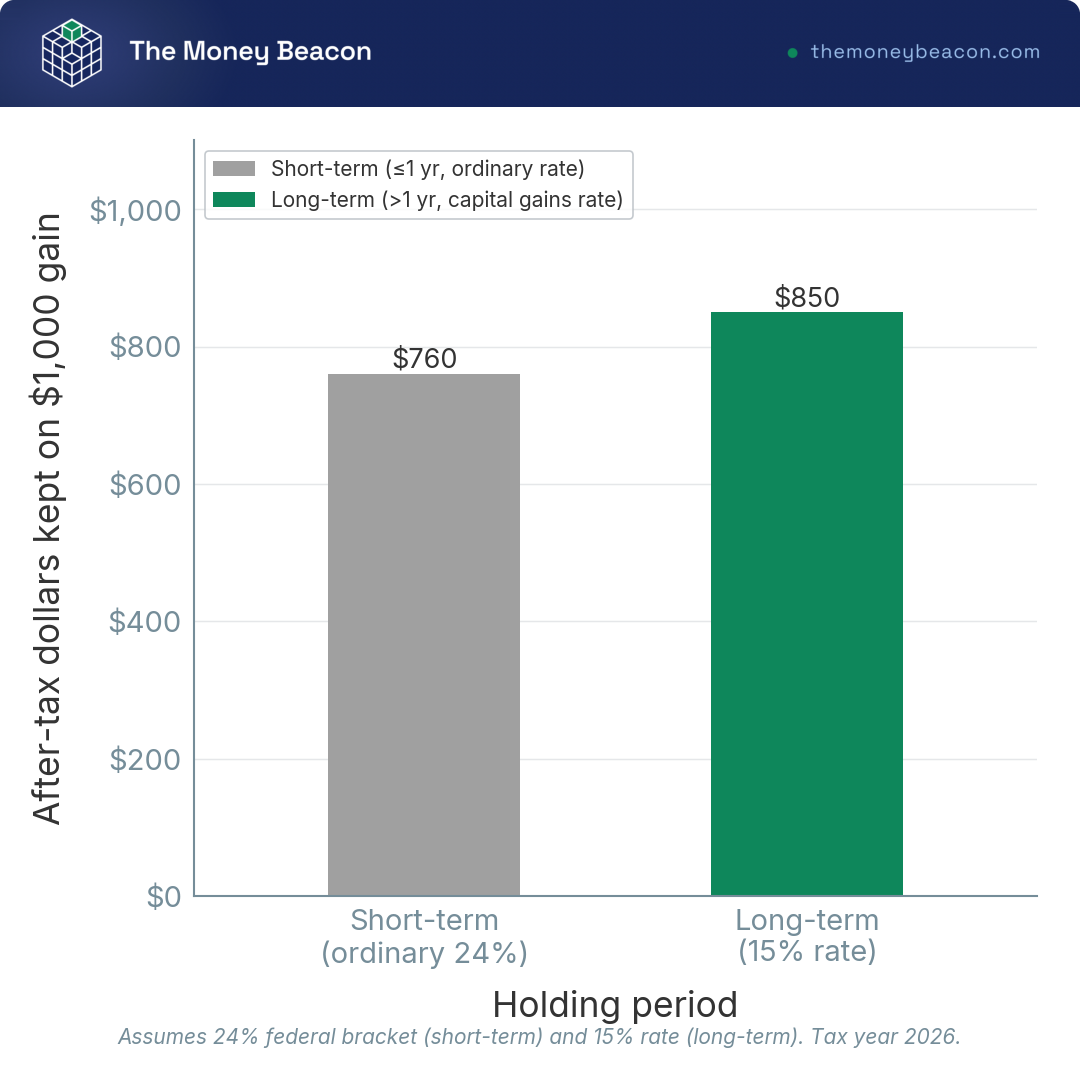
Put the gap in dollars and it stops being abstract. Take a clean $1,000 gain for someone in the 24% bracket. Earn it on a quick trade and it is short-term, taxed at 24%, so you keep $760. Earn the identical $1,000 by holding more than a year and it is long-term at 15%, so you keep $850. Same gain, same dollars at work, and the patient version leaves you $90 richer on every thousand purely because of when you sold. That is the structural disadvantage a trader carries into every year, paid on the winners while the losers still hurt at full size.
And the rule that’s supposed to soften the losers comes with its own trap.
7.3 The wash-sale rule and cost-basis tracking
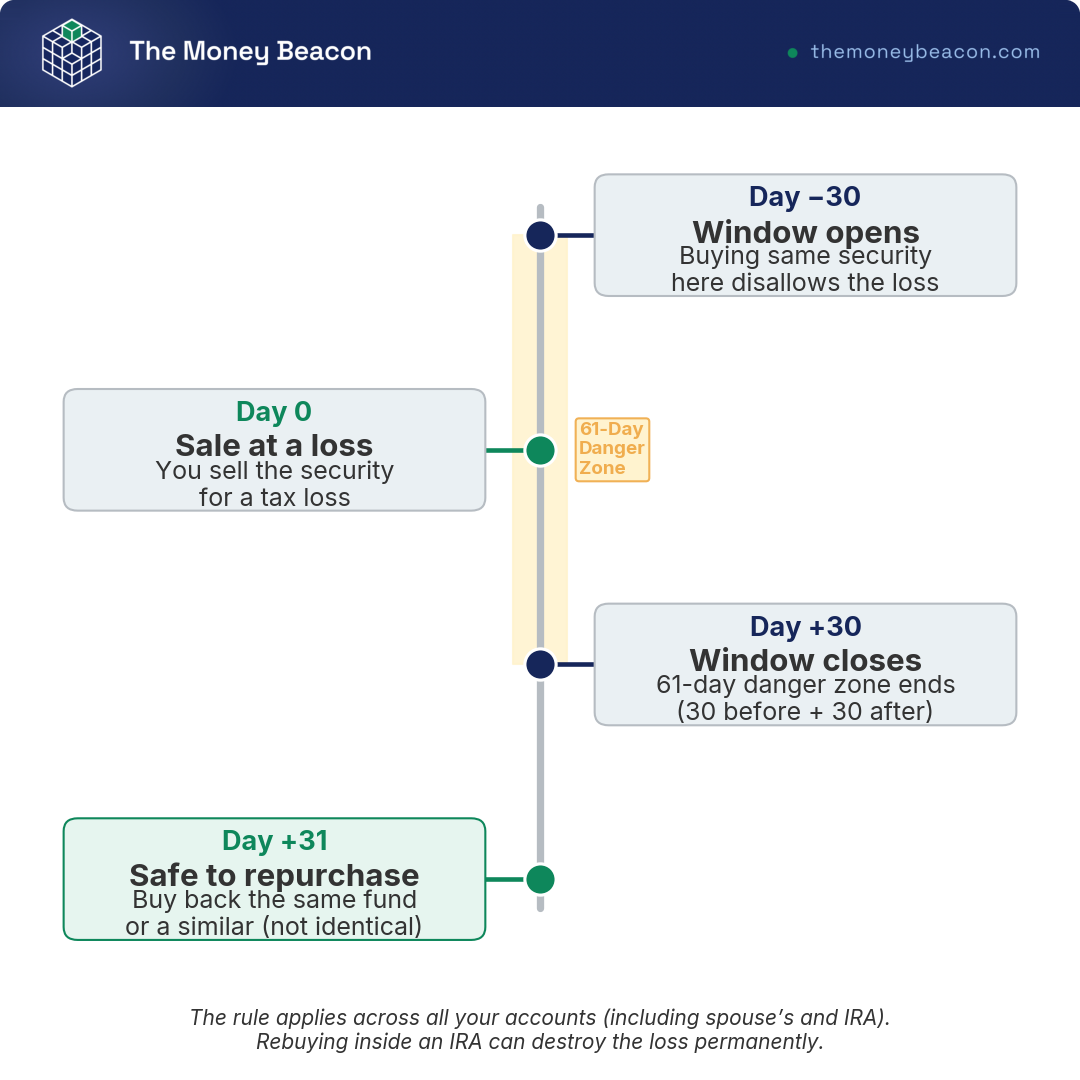
Selling a loser to bank the tax deduction feels like the one consolation prize in a bad trade, and the wash-sale rule is built to take it away if you’re too quick about it. The rule disallows the loss deduction if you buy the same or a substantially identical security within 30 days before or after the sale, a 61-day window with the sale date in the middle. So buy a stock, sell it at a loss, then jump back in a week later, and the IRS will not let you deduct that loss this year.
The loss isn’t gone, though, which is the part worth getting right. A disallowed loss is added to the cost basis of the replacement shares, so it’s deferred into the next sale rather than destroyed, with one brutal exception: rebuy the replacement inside an IRA and the loss can vanish permanently, because there’s no taxable basis there to carry it. The rule also reaches across all your accounts, including your spouse’s and your own IRA, so you can’t dodge it by selling in one account and buying in another. The clean way to harvest a loss and stay invested is to wait 31 days before rebuying, or to buy a fund that isn’t substantially identical, a different broad index tracking the same market rather than the exact same one.
One scope commentary, because beginners ask. The wash-sale rule as written applies to stocks and securities, and the IRS hasn’t extended it to cryptocurrency by statute, so crypto is generally treated as falling outside it for now, though that’s an area to watch rather than a settled exemption to lean on. For your stock and ETF trades, the 61-day window is real, and the broker’s basis tracking on the 1099-B is what flags it.
7.4 Active trader vs. index holder: a one-year comparison
Run $10,000 two ways, give both the same generous 8% gross return, and watch where they diverge. The active trader pays $0 commission but bleeds roughly 1% to 3% to spread and slippage across a year of turnover, then hands the IRS the higher ordinary rate on a short-term gain. The index holder pays a near-zero expense ratio (total-market funds run from 0.00% to 0.04% in 2026), no spread to speak of, and defers all tax until a future sale that will then qualify for long-term rates. Same starting cash, same gross return, and the active trader’s net lands below the index holder’s.
One year, $10,000, active trader vs. index holder (illustrative)
| Item | Active trader | Index holder |
|---|---|---|
| Gross return assumption | 8% | 8% |
| Commissions | $0 | $0 |
| Spread/slippage drag | ~1%-3% | ~0% |
| Fund expense ratio | n/a | 0.00%-0.04% |
| Tax on gains | Short-term (ordinary) | Deferred until sale; then LT |
| Net outcome tendency | Lower after costs/tax | Higher after costs/tax |
Data current as of June 2026.
There is one exit from this tax math, and it’s worth naming precisely so you know it’s not yours yet. A small minority of very high-volume traders qualify for Trader Tax Status, which treats the activity as a business and lets them deduct expenses, and they can then make a Section 475 mark-to-market election that turns gains and losses ordinary, switches the wash-sale rule off, and lifts the $3,000 cap on deducting net losses. The catch is the bar to get there: the IRS wants substantial, continuous, high-volume activity pursued like a livelihood, the election carries strict deadlines, and you wouldn’t attempt it without a tax professional. For a beginner trading a small sleeve, this isn’t a door you’re knocking on, and you can read more about the patient alternative in our comparison of low-cost index funds and ETFs.
8. The honest verdict: trade a satellite, index the core
So after the odds, the costs, and the tax form, the blunt question is whether a beginner should trade individual stocks at all. The honest answer isn’t “no,” and it isn’t “go for it.” It’s an allocation: index the core, trade a small satellite, and treat the satellite as paid education. Let’s start with the evidence on whether active effort beats indexing, size that evidence into a core-and-satellite split, and close with a one-page decision map and a checklist that fold every earlier section into a sequence you can actually follow.
8.1 Should a beginner trade stocks or just index? The evidence
The strongest argument against active trading isn’t that beginners lose; it’s that the professionals mostly lose too. The SPIVA scorecard from S&P Dow Jones Indices tracks active fund managers against their benchmark, and over long horizons the verdict is consistent: in the data through December 31, 2025, roughly 90% of large-cap active funds underperformed the S&P 500 over both the 10-year and 15-year windows. These are full-time professionals with research teams, Bloomberg terminals, and risk desks, and they still cannot beat a plain index over a decade. So a part-time beginner trading after work, against those same professionals and their algorithms, faces longer odds, not shorter ones.
That reframes where your money should sit. The S&P 500’s long-run return is about 10% nominal a year, earned by holding, not by trading, and the practical rule follows directly: money you’ll need in more than five years belongs in a low-cost index fund, not a trading account. If you want the buy-and-hold side of this in detail, our comparison of which broad index funds to hold lays out the core holdings worth starting from.
8.2 Core-and-satellite: how much should you actually trade?
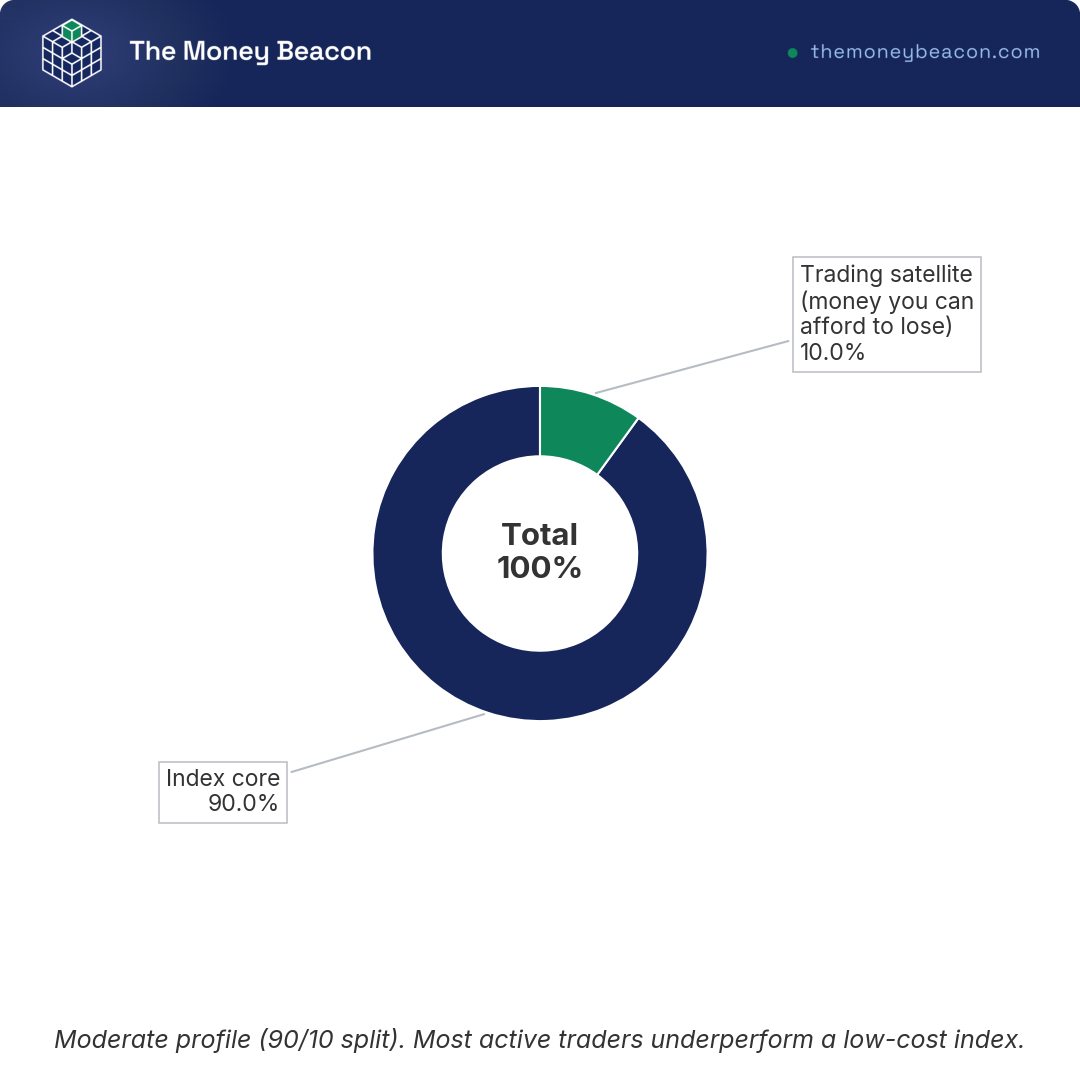
If the core is sacred and the urge to trade is real, the structure that honors both is core-and-satellite: keep the large majority of your money in broad index funds, and ring-fence a small sleeve for active trading that you can afford to lose entirely. How small depends on your tolerance for tuition. A conservative split is 95% index core, 5% satellite; a moderate one, the standard beginner default, is 90/10; and an aggressive one, only after you’ve got experience and rules that hold, is 80/20.
Core-and-satellite allocation by risk tolerance (illustrative)
| Profile | Index core | Trading satellite | Rationale |
|---|---|---|---|
| Conservative | 95% | 5% | Learn with minimal damage |
| Moderate | 90% | 10% | Standard beginner split |
| Aggressive | 80% | 20% | Only with experience and rules |
Data current as of June 2026.
The discipline is to size the satellite before you fund anything, not to let it grow by accident as a few winners tempt you to feed it. Decide the percentage, fund that and no more, journal every trade inside it the way section 2 laid out, and once a quarter compare the satellite’s result against what a plain index would have done with the same money. That last step is the honest scoreboard most traders avoid, and it’s the one that tells you whether your sleeve is tuition well spent or a slow leak.
Tom’s take
running a multi-asset portfolio, I treat the most active sleeve exactly this way: a deliberately capped slice I can afford to write off, sized in advance and walled off from the long-term core. The point of it is not the return, it is what the live, real-money mistakes teach you that no simulator can, and the only way that bargain works is if the slice stays small enough that the lesson never costs you the core.
For readers who decide the math points entirely the other way, the buy-and-hold index approach is a complete strategy on its own, with no satellite required.
8.3 Your start-trading decision map and checklist
Everything in this guide collapses into two pages you can keep beside the screen. The first is the decision map: for each choice you face, the beginner default, why it matters, and the mistake that catches people. The second is the running checklist, nine steps from preparing the cash to reviewing the results, each with what to do and what to avoid.
The beginner’s start-trading decision map (synthesis of the central question)
| Decision | Beginner default | Why it matters | Common mistake to avoid |
|---|---|---|---|
| Account leverage | Cash account | No margin risk; no margin-based day-trading rules apply | Opening margin “by default” |
| Tax wrapper | Taxable for flexible trading; small Roth sleeve to defer tax | Short-term gains are ordinary income | Trading high-turnover in a Roth and burning contribution room |
| Broker | $0-commission broker matching your instrument; check options fee + execution | Hidden costs are options/margin/spread | Picking on app looks, ignoring routing/fees |
| First order type | Limit order | Controls price; avoids slippage | Defaulting to market orders in thin names |
| Downside control | Stop-loss on every position | Caps the loss in dollars | Widening the stop after entry |
| Position size | 1%-2% of equity risked per trade | Survives losing streaks | Sizing by gut, over-leveraging after a win |
| Day-trade frequency | Use a cash account or confirm your broker’s day-trading policy | The old federal $25,000 PDT threshold was removed June 4, 2026; brokers set their own intraday-margin rules | Assuming “no rule” means no broker limits |
| Practice | 20-40 paper trades, then trade tiny | Learns mechanics at zero risk | Skipping straight to real size |
| Taxes | Track basis; mind wash-sale (61-day) | Short-term tax + disallowed losses erode returns | Rebuying within 30 days at a loss |
| Overall strategy | Index core, small trading satellite | Most active traders/managers underperform | Trading the whole account |
Start-trading checklist (To do / To avoid / Common mistake per step)
| Step | To do | To avoid | Common mistake |
|---|---|---|---|
| 1. Prep | Fund emergency savings first; use discretionary cash | Trading rent or borrowed money | Treating trading capital as savings |
| 2. Account | Open a cash account at a reputable broker | Margin before you understand it | Auto-enabling margin |
| 3. Fund | ACH small; confirm settlement | Wiring large sums before testing | Forgetting T+1 / Good Faith Violations |
| 4. Learn orders | Master limit, stop, stop-limit | Market orders in illiquid names | Confusing stop vs. stop-limit |
| 5. Risk rules | Set 1%-2% risk, stop, and target before entry | Trading without a stop | Moving the stop after entry |
| 6. Practice | 20-40 paper trades on a written plan | Skipping the journal | Mistaking luck for skill |
| 7. Go live small | Start at minimum size | Sizing up to “make it worthwhile” | Over-leveraging early |
| 8. Tax hygiene | Track basis; respect wash-sale; file 8949/Sch D | Rebuying within 30 days at a loss | Ignoring short-term tax drag |
| 9. Review | Compare results to a simple index | Hiding from the scoreboard | Not benchmarking against indexing |
Read down either table and the whole guide reduces to one sentence: trade small, by rules, with money you can lose, and keep the bulk of your savings in the index.
Conclusion
Starting to trade is less about picking a winner and more about installing the controls before you risk a dollar. The honest verdict I keep coming back to is an allocation, not a yes or no: index the core with the money you will need in more than five years, and ring-fence a small satellite of 5% to 20% that you can afford to lose entirely. The realistic frame is to treat an active sleeve as paid tuition, not a path to beating the index.
Two details decide more outcomes than any trade idea. The first is cost and tax drag, because a short-term gain is taxed as ordinary income at your bracket while a long-term hold qualifies for the lower 0%, 15%, or 20% rates, which is why patience quietly keeps more of every gain. The second is position sizing: risk 1% to 2% of equity on each trade, set the stop before entry, and never widen it afterward.
If you want to go further, dig into the buy-and-hold index approach that anchors the core, compare the accounts and routing in our guide to online brokerages, or weigh a hands-off route in our breakdown of robo-advisors. Past performance never guarantees future results, and that is exactly why the rules matter more than the predictions.
Frequently Asked Questions
How much money do I need to start trading, and is $100 enough?
Technically, $100 is enough. Most US brokers have no account minimum and offer fractional shares, so a hundred dollars, or even twenty, can buy a slice of a stock or ETF. The harder question is whether it is worth it. At that size the trading costs and the bid-ask spread eat a much larger share of your money, and you cannot diversify or size your positions sensibly. A more realistic path is to open a cash account, fund it with a few hundred to a few thousand dollars of genuinely discretionary cash after your emergency fund is set, practice on paper, and then trade in tiny amounts. Treat your first year as tuition rather than income, and you will spend it learning the platform instead of chasing a payday. If you are still choosing where to open the account, our brokerage accounts comparison walks through the no-minimum options.
Is there still a pattern-day-trader rule and a $25,000 minimum?
No, not in the form most people remember. The old pattern-day-trader rule flagged a margin account that placed four or more day trades within five business days when those trades exceeded 6% of total activity, and it forced that account to hold at least $25,000 in equity. FINRA superseded that regime effective June 4, 2026, under Regulatory Notice 26-10, with a transition period running through October 20, 2027. The amended intraday-margin requirements removed both the pattern-day-trader designation tied to counting trades and the standalone $25,000 minimum-equity trigger. Day-trading constraints now flow from broader intraday-margin rules and from each broker’s own day-trading policy, so confirm the specifics where you trade. Remember that “no federal threshold” does not mean “no rule.” If you want to avoid margin-based limits entirely, a cash account sidesteps them, though you then have to respect T+1 settlement and Good Faith Violations.
Can I trade inside a Roth IRA or other retirement account?
Yes, and the tax treatment is the main reason to consider it. You can buy and sell stocks, ETFs, and, with the right approval, options inside a Roth or traditional IRA, and gains are not taxed each time you sell, so the short-term-gain tax drag that hurts active traders simply disappears. The trade-offs are real, though. An IRA allows no margin and no true short selling, contributions are capped at $7,500 for 2026 with a $1,100 catch-up at age 50 and over for an $8,600 total, and a loss inside the account is not tax-deductible. The biggest risk is spending irreplaceable Roth room on high-turnover bets you might lose. For most people the account works best as a long-term home for steady holdings, which our retirement planning guide covers in more depth.
How are my trading profits taxed in the United States?
It comes down to your holding period. Positions you hold for one year or less produce short-term gains taxed as ordinary income, which runs from 10% to 37% depending on your bracket. Positions held longer than a year qualify for long-term rates of 0%, 15%, or 20%, with an additional 3.8% Net Investment Income Tax layered on top once your modified adjusted gross income passes $200,000 single or $250,000 married filing jointly. Since most trades are short-term, active traders usually pay the higher ordinary rates. You report your trades on Form 8949 and Schedule D, using the 1099-B your broker issues, and you should watch the wash-sale rule, which can disallow a loss if you rebuy the same security within 30 days. None of this is tax advice, and past results never guarantee future ones, so check your own situation before you rely on a number.
Which order type is safest, and how is a stop-limit different from a limit?
For most beginners, a limit order is the safest way to enter because it controls the price you pay and protects you from slippage. A plain market order guarantees that your trade executes but not at what price, so I would reserve it for highly liquid names where the spread is tight. The distinction people stumble over is between a limit and a stop-limit. A limit order simply sets the price you are willing to accept. A stop-limit stays dormant until a trigger price is reached, then turns into a limit order, so it controls your price after a level breaks but may not fill at all in a fast-moving gap. A plain stop, by contrast, becomes a market order at the trigger, so it fills reliably but at an uncertain price. The cleanest first setup is a limit order to enter paired with a pre-set stop, which fixes both your entry and your maximum loss before you commit a dollar.




Comments
Questions and corrections welcome. We read everything.