


Most people carry a low hum of worry about retirement without ever pinning down the one thing that would quiet it: a real number. You suspect you are behind, but behind what? So the savings sit in whatever account a coworker mentioned, the employer match goes half-captured, and the biggest question of all, when to claim Social Security, gets answered by default at 62. The unease is earned. The median near-retiree household, ages 55 to 64, holds roughly $185,000, a fraction of the 8-to-10-times-salary figure the popular benchmarks suggest, so if you feel behind, you have plenty of company.
Here is the better news: retirement planning isn’t one terrifying unknown, it’s four questions you can actually answer. How big does your number need to be, using the 25x and 4% rules? In what order should you fund your accounts to keep the tax bill down? What should you have saved by your age, and what’s the smartest way to claim Social Security? And once the nest egg is built, how do you turn it into a paycheck that lasts?
1. How Much Money You Actually Need to Retire
So where does your number come from? Not a headline like “$1 million,” and not a multiple of your salary. It starts with what you spend, and the rest is arithmetic you can do at your kitchen table.
1.1 Start With Spending and the 25x Rule
The mistake most people make is sizing their retirement off their gross income. Income is what comes in while you work; spending is what your portfolio actually has to cover once the paychecks stop. The figure that decides how much money you need to retire is annual spending, and it is usually lower than you expect.
There are three steps, and the first is the one almost everyone skips. Start by estimating your annual spending in retirement. Spending tends to fall with age: the Consumer Expenditure Survey data put it near 62% of younger-household spending for those age 65 to 74, and closer to 50% past age 75, because payroll taxes, retirement saving, and (often) a mortgage have all ended by then. Those are observed averages, not your personal target, so adjust up if you plan to travel hard or face heavy health costs. Next, subtract your guaranteed income, mostly Social Security and any pension. What remains is the portfolio-funded gap, the slice your savings have to pay for. Finally, multiply that gap by 25.
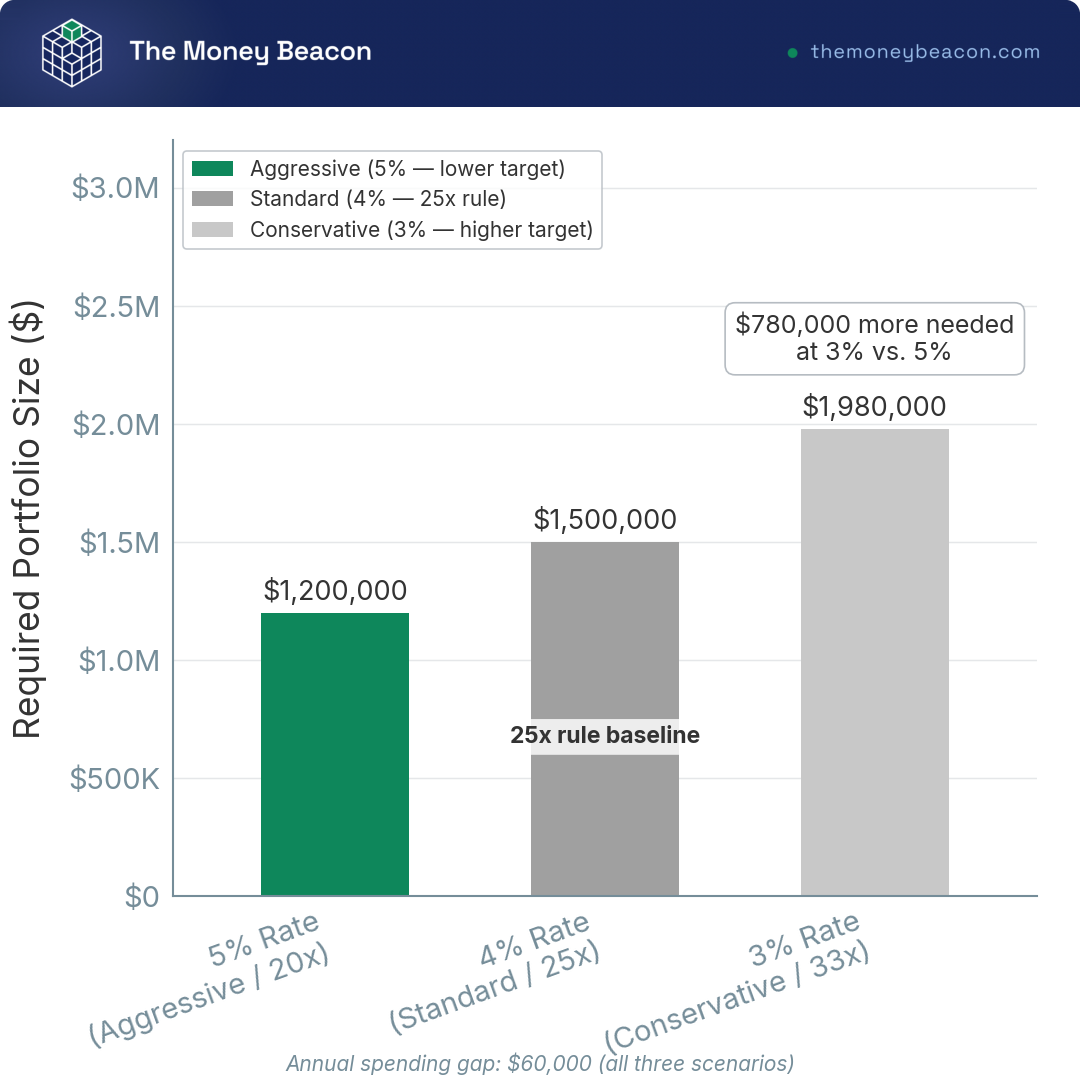
A quick worked case makes this more tangible. Say a household spends $80,000 a year and expects $24,000 from Social Security: that leaves a $56,000 gap, which points to a target near $1.4 million ($56,000 times 25). The 25x rule is simply the arithmetic inverse of a 4% withdrawal rate, since 1 divided by 0.04 equals 25. It is a sizing shortcut, not a withdrawal plan, and you can flex it. Take a cleaner $60,000 gap: at 25x you need $1.5 million, at a conservative 3% rate (33x) you need $1.98 million, and at an aggressive 5% rate (20x) you need $1.2 million. The table below runs the same logic across spending levels.
| Annual portfolio-funded spending | 25x target (4% rule) | 33x target (3% conservative) | 20x target (5% aggressive) |
|---|---|---|---|
| $40,000 | $1,000,000 | $1,320,000 | $800,000 |
| $60,000 | $1,500,000 | $1,980,000 | $1,200,000 |
| $80,000 | $2,000,000 | $2,640,000 | $1,600,000 |
| $100,000 | $2,500,000 | $3,300,000 | $2,000,000 |
One caveat: these are pre-tax portfolio values, so taxes on your withdrawals will trim what you can actually spend. Your step today is to write down your best guess at retirement spending and run it through the multiplier.
1.2 The 4% Safe-Withdrawal Rule and Where It Came From
You just multiplied by 25, which raises a fair question: where does that 4% come from, and why should you trust it? It is not a marketing number. It traces to William Bengen’s analysis in the October 1994 issue of the Journal of Financial Planning, then to the Trinity study (Cooley, Hubbard, and Walz, Trinity University, 1998), which tested it against decades of US market history.
The mechanics matter more than the headline. You withdraw 4% of your starting balance in year one, then raise that dollar amount by inflation each year, rather than recalculating 4% of the new balance. The original work assumed a 30-year horizon and a stock-heavy balanced portfolio, commonly somewhere between 50/50 and 75/25 stocks to bonds. Under those assumptions, a 50/50 portfolio survived the full 30 years in about 95% of rolling historical periods from 1926 to 1995. The table translates each assumption into a practical reading for an actual retiree.
| Trinity-style assumption | Original study basis | Practical reading for a retiree |
|---|---|---|
| Withdrawal | 4% of initial balance, inflation-adjusted thereafter | Fixed real income, ignores the market each year |
| Horizon | 30 years | A 65-year-old planning to about 95; longer for early retirees |
| Allocation | About 50/50 to 75/25 stocks/bonds | Too conservative actually lowers success at 4% |
| Success metric | Portfolio survives the full horizon | Says nothing about how much is left over |
One detail in that last row is easy to miss: a portfolio that is too cautious can fail at 4% just as a too-aggressive one can, because bonds alone struggle to outrun inflation over 30 years. The rule is a tested baseline, not a promise. And before you anchor on it, know this: that 95% figure describes the past, and past performance does not guarantee future results, which is exactly why the rate is a range rather than a fixed law.
1.3 When 4% Is Too High or Too Low
The honest answer to “is 4% safe?” is that it depends on four things: your horizon, your fees, market valuations when you start, and how flexible you are willing to be about spending. Treat 4% as the center of a defensible range, not a number carved in stone.
Stretch the horizon well past 30 years, the case for someone retiring at 50 to 55, and the picture splits. Bengen’s updated work (2025) defends a starting rate near 4.2% to 4.3% even over a 40-to-50-year horizon, and as high as 4.7% with a more diversified asset mix, while more cautious analyses from Schwab and others argue for 3% to 3.5% over such long periods. There is no single right answer, only a reasoned range. Fees pull the other way: a 1% advisor fee stacked on 0.5% fund fees drags your sustainable withdrawal down by roughly that 1.5%, dollar for dollar. High starting valuations or low rates push some researchers toward a lower initial rate. And if you are willing to trim spending in bad years, a higher start with guardrails becomes defensible, a strategy we come back to when we turn savings into income.
So where do you actually put the money you are saving toward that target?
2. The Account Lineup: 401(k), IRA, HSA, and Taxable
A target is useless until you know what holds the savings. Before we rank anything, one distinction prevents most of the expensive mistakes that follow, and from there we take the accounts one at a time, from the workplace 401(k) you probably already have to the options for readers who work for themselves.
2.1 Accounts vs. Asset Classes, and the 401(k) Match
Here is the confusion that trips up more savers than any other: treating an account and an investment as the same kind of thing. They are not. A Roth IRA (individual retirement account) is a tax wrapper, a container with its own tax rules. An index fund or an ETF (exchange-traded fund) is an asset class, the thing that goes inside the container. Asking “should I buy a Roth IRA or an ETF?” is like asking whether you should buy a garage or a car. You put the car in the garage.
The distinction also governs what is insured. FDIC and NCUA coverage (the Federal Deposit Insurance Corporation for banks, the National Credit Union Administration for credit unions; $250,000 per depositor, per institution, per ownership category) protects bank and credit-union deposits, not investments. Brokerage assets fall under SIPC, the Securities Investor Protection Corporation ($500,000 per customer, including a $250,000 cash sublimit), which covers the failure of the broker, not losses in the market. Never call a brokerage account “FDIC-insured,” because it is not, and the difference matters the day something goes wrong.
With that settled, start with the account most of us already have: the workplace plan. In the private sector it is a 401(k); nonprofits and schools use a 403(b), and government workers a 457(b). You contribute through salary deferrals, often with an employer match, all under ERISA oversight from the Department of Labor’s Employee Benefits Security Administration. For 2026, the employee deferral limit is $24,500, the age-50 catch-up is $8,000, the special catch-up for ages 60 to 63 is $11,250, and the combined employee-plus-employer limit reaches $72,000. New this year under SECURE 2.0, catch-up contributions must be Roth for anyone whose prior-year FICA wages from the same employer topped $150,000.
The match is the part that pays you immediately. A typical formula is 50% of the first 6% of pay, the most common structure in Vanguard’s plan data, which means deferring 6% earns a 3% employer contribution on top. You can split your own contributions between traditional (pre-tax now, taxed later) and Roth (after-tax now, tax-free later), and here is a useful wrinkle: the employer match lands in the pre-tax bucket even when your own money is Roth, unless your plan has opted into Roth matching. If you want the full mechanics, our complete 401(k) breakdown with 2026 limits walks through every contribution tier. Today’s step is simple: confirm your match formula and make sure you are capturing all of it.
2.2 Traditional vs. Roth IRA
After the workplace plan, the account you open yourself is the IRA, held at a custodian such as Fidelity, Vanguard, or Schwab, all of which offer no-fee IRAs (the funds inside still carry their own expenses). The 2026 limit is $7,500, plus a $1,100 catch-up at 50 and older. The defining choice is traditional versus Roth, and it comes down to one bet: is your tax bracket higher now or in retirement?
Income limits shape the decision. The Roth IRA contribution phases out in 2026 between $153,000 and $168,000 for single filers and $242,000 and $252,000 for married couples filing jointly; above the top of the range, the direct contribution closes and you use the backdoor route we cover shortly. Traditional IRA deductibility, separately, phases out when you or your spouse are covered by a workplace plan. The table compares the two wrappers on the features that actually drive the choice.
| Feature | Traditional IRA | Roth IRA |
|---|---|---|
| Contribution | Maybe deductible (income/coverage limits) | After-tax, never deductible |
| Growth | Tax-deferred | Tax-free |
| Qualified withdrawal | Taxed as ordinary income | Tax-free (age 59 1/2 plus the 5-year rule) |
| Income limit to contribute | None to contribute; limit to deduct | Yes (phase-out above) |
| RMDs | Yes, starting age 73 | None for the original owner |
For you, the practical read is this: if your bracket is low today, early in your career or in a down-income year, the Roth usually wins, because you pay tax now at a cheap rate and never again. If you are in your peak earning years at a high bracket, the traditional deduction may be worth more. Our guide covering every Roth IRA rule and edge case handles the trickier situations. So decide which side of that bracket bet you are on, then open the account.
2.3 The HSA: A Stealth Retirement Account
The IRA gives you tax-deferred or tax-free growth, but one account beats both on paper, and most people use it only as a checking account for copays. The Health Savings Account (HSA) is the only triple-tax-advantaged account: contributions go in pre-tax, growth is tax-free, and withdrawals for qualified medical expenses are tax-free too. The catch is eligibility, since you must be enrolled in a high-deductible health plan (HDHP) to contribute. The 2026 limits are $4,400 self-only and $8,750 family, plus a $1,000 catch-up at 55 and older.
Here is the stealth-retirement move that turns a medical account into an investing account. If you can afford it, pay current medical bills out of pocket, save every receipt, and let the HSA balance stay invested for decades. There is no deadline on reimbursing yourself, so you can pull that money out tax-free years later against those old receipts, after the account has compounded. And once you hit age 65, non-medical withdrawals are taxed as ordinary income with no penalty, so a leftover HSA behaves like a traditional IRA in the worst case and like free money in the best. Providers differ on fees and investment access: the Fidelity HSA charges no account fee and lets you invest, while Lively and HealthEquity are also common, so confirm the fee schedule before you open one. Before you can use any of this, you have to confirm your plan qualifies, which our guide to high-deductible health plan eligibility spells out.
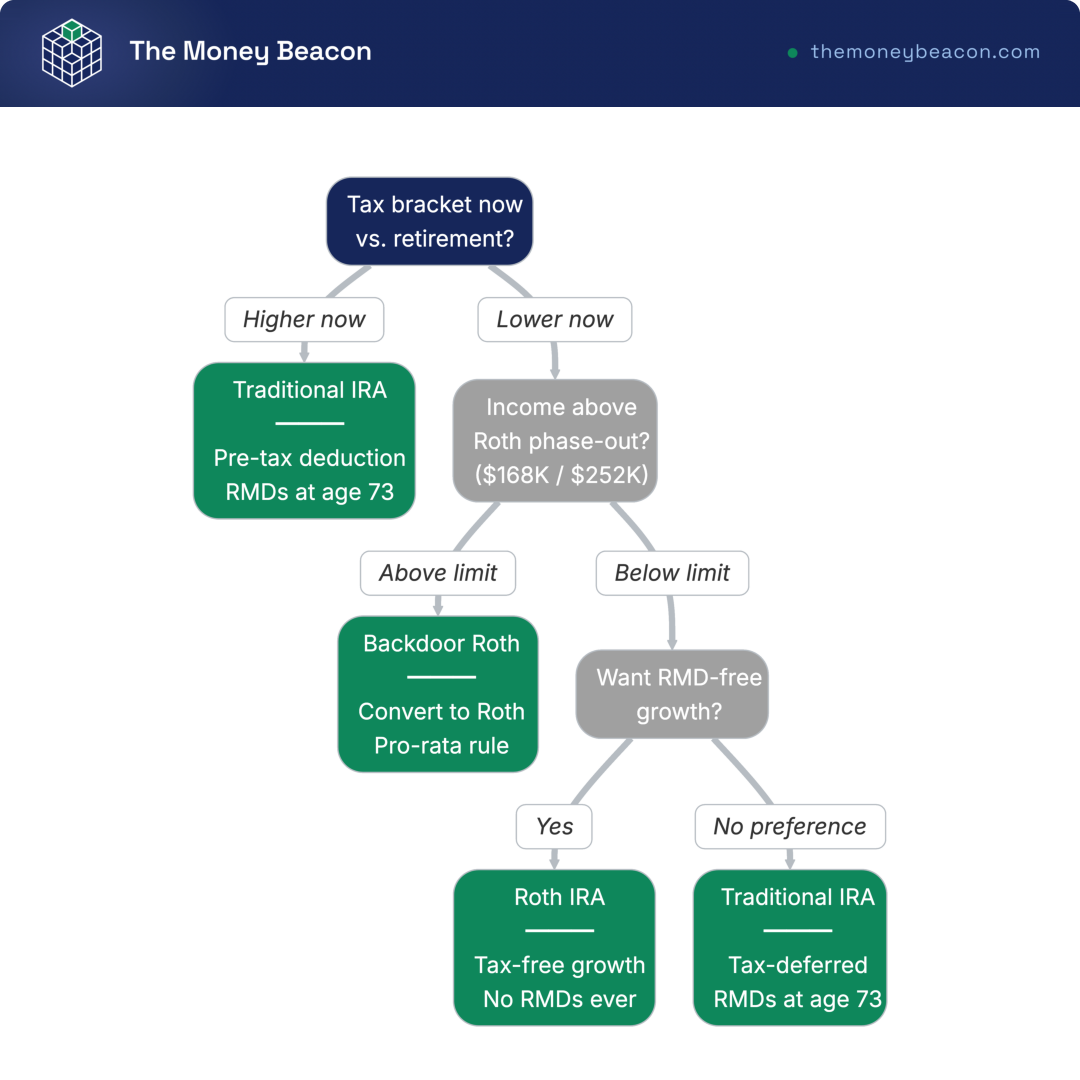
That decision tree turns the IRA choice into a path: check your bracket, check whether you clear the income limit, and decide whether RMD-free money matters to you.
2.4 The Taxable Brokerage Account: Flexible but Last
What happens when you have maxed the 401(k), the IRA, and the HSA, and still have money to invest? You reach for the taxable brokerage account, the most flexible container of all and, for most people, the last one to fund. It has no contribution limit, no income limit, and no withdrawal restriction, but it also gives you no tax shelter, which is why it sits after the others. There are two honest exceptions, though: it is the natural home for money you will need before age 59 1/2, and for early-retirement liquidity.
The tax rules are worth getting right, because this is where they bite. Long-term capital gains on assets held more than a year are taxed at 0%, 15%, or 20% depending on your taxable income, never a flat 15% for everyone. Short-term gains, on assets held a year or less, are taxed as ordinary income at 10% to 37%, which is the main reason patience pays here. Qualified dividends get the favorable long-term rates; ordinary dividends and interest do not.
One trap for higher earners: the 3.8% Net Investment Income Tax (NIIT) stacks on top of, not instead of, the capital-gains rate above $200,000 of MAGI single or $250,000 married filing jointly, pushing the top federal rate on long-term gains to 23.8%, and those thresholds are not indexed to inflation, so more households drift into them each year. On the upside, only the taxable account lets you harvest losses to offset gains and pass assets to heirs with a stepped-up basis at death.
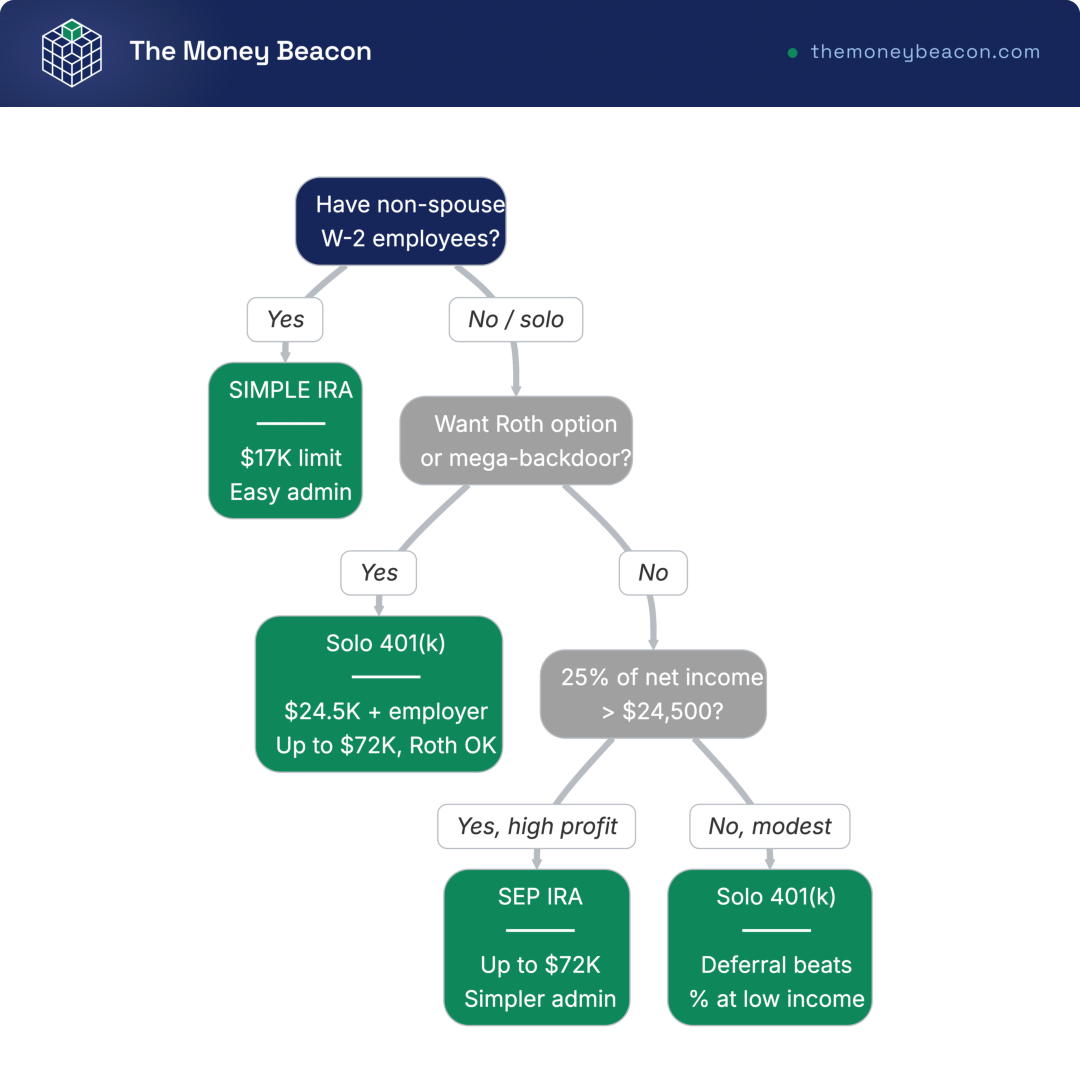
That last container assumes you have a workplace plan and an IRA to fill first. If you work for yourself, the lineup looks different, and the decision tree above previews the choice we work through next. For readers comparing brokers in the meantime, our roundup of the best online brokerage accounts covers the fee and feature differences. So which account stands in for the 401(k) when there is no employer?
2.5 Self-Employed Accounts: SEP IRA, Solo 401(k), and SIMPLE IRA
If you are a freelancer, a 1099 contractor, or a one-person business, you do not get an employer match, but you do get your own set of powerful plans. The three to know are the SEP IRA, the Solo 401(k), and the SIMPLE IRA, and they differ sharply on how much you can stash and whether a Roth option is available. The table compares them on the points that decide the choice.
| Account | 2026 contribution headroom | Best when |
|---|---|---|
| SEP IRA | Up to $72,000 (employer-side, about 25% of net self-employment income) | Simple, one-person, want a high limit, no employees you must also cover |
| Solo 401(k) | Employee deferral $24,500 plus profit-sharing, up to $72,000 total (plus catch-up) | Want a Roth option, want to maximize at lower income via the deferral |
| SIMPLE IRA | $17,000 employee | A very small business wanting an easy plan |
Data current as of June 2026.
The counterintuitive lesson is that the Solo 401(k) often beats the SEP at modest income. The SEP caps your contribution at roughly 25% of profit, so a freelancer earning, say, $60,000 is limited by that percentage. The Solo 401(k) lets you defer up to the full $24,500 as an employee first and then add the profit-sharing piece, so you can shovel in far more at the same income, and it permits Roth contributions (and often a mega-backdoor Roth) that a SEP simply does not offer. One warning to carry into the next section: if you hold pre-tax money in a SEP or SIMPLE IRA, those balances can trigger the pro-rata rule on a backdoor Roth, a trap we untangle in a moment. For now, match your situation, employees or not, Roth or not, against the table and pick your plan.
Knowing the containers is not the same as knowing which one to fill first, and that order is where every dollar finally gets a job.
3. The Tax-Smart Order to Fill Your Accounts
You have a target and you have the accounts. The question your next paycheck has to answer is where that dollar should go first, because the sequence is itself a tax decision worth tens of thousands of dollars over a career.
3.1 The Default Waterfall: Where Your Next Dollar Goes
Picture your savings as water filling a series of buckets, each one overflowing into the next only when it is full. The order is not arbitrary; it runs from the highest-certainty return to the lowest. Here is the default waterfall, with the 2026 caps that govern each step.
| Step | Action | Why it ranks here |
|---|---|---|
| 1 | 401(k) up to the full employer match | The match is an instant 50% to 100% return; nothing else matches it |
| 2 | Pay off high-interest debt (often parallel to step 1) | A 20% APR (annual percentage rate) card is a guaranteed 20% “return” to eliminate |
| 3 | Max a Roth IRA ($7,500) | Tax-free growth, flexible, broad investment menu |
| 4 | Max the HSA ($4,400 self-only / $8,750 family) if HDHP-eligible | The only triple-tax-advantaged account |
| 5 | Max the 401(k) ($24,500 total) | Large tax-deferred or Roth space |
| 6 | Taxable brokerage for everything else | No limits, flexible, but no shelter |
Data current as of June 2026.
The single most important line is the first one. Before you do anything else, set your 401(k) deferral high enough to capture the full match, because that is the highest-certainty return you will ever get on a dollar. Run the numbers on an $80,000 salary with a 50%-of-first-6% match: defer 6% ($4,800) and you capture a $2,400 match every year. Skip it and you hand back $2,400 annually. Invested as a $2,400 yearly contribution over 30 years, that forgone match grows to roughly $190,000 at a 6% return, or about $227,000 at 7%, on the usual caveat that past returns are not a forecast. That is the cost of “I’ll start contributing next year.” Aim for a total savings rate around 12% to 15% of gross pay including the match, higher if you started late.
Tom’s take

I’ve optimized money across financial, tax, legal, and estate angles for years, and the employer match is the one move with no catch and no downside. It is the closest thing to free money I have come across, and walking past it to chase a hot fund is a trade I would never make.
The step you can take today is the cheapest to fix and the most expensive to ignore: log in to your plan and raise your deferral to at least the full match. Once that bucket overflows, the rest of the order tells you where the next dollar lands.
3.2 The Backdoor Roth, the Pro-Rata Trap, and When the Order Changes
The waterfall assumes you can contribute to a Roth IRA directly, but what if your income is above the phase-out we saw earlier? The limit is a phase-out, not a cliff, so the door is not closed; you just walk through it the long way. The backdoor Roth is the move: contribute to a nondeductible traditional IRA, then convert that balance to a Roth. Done cleanly, it puts a high earner back on step 3 of the waterfall.
The trap is the pro-rata rule (IRC 408(d)(2)). If you hold other pre-tax IRA money, including SEP, SIMPLE, or rollover IRAs, the conversion is taxed proportionally across all of those balances, not just your new nondeductible dollars, which can turn a “tax-free” backdoor into a surprise tax bill. The fix, when your plan allows it, is to first roll any pre-tax IRA balance into your 401(k), emptying the IRA side so the conversion lands clean; Form 8606 then reports the basis. The mechanics, including how to sequence the rollover, are covered in our backdoor Roth walkthrough.
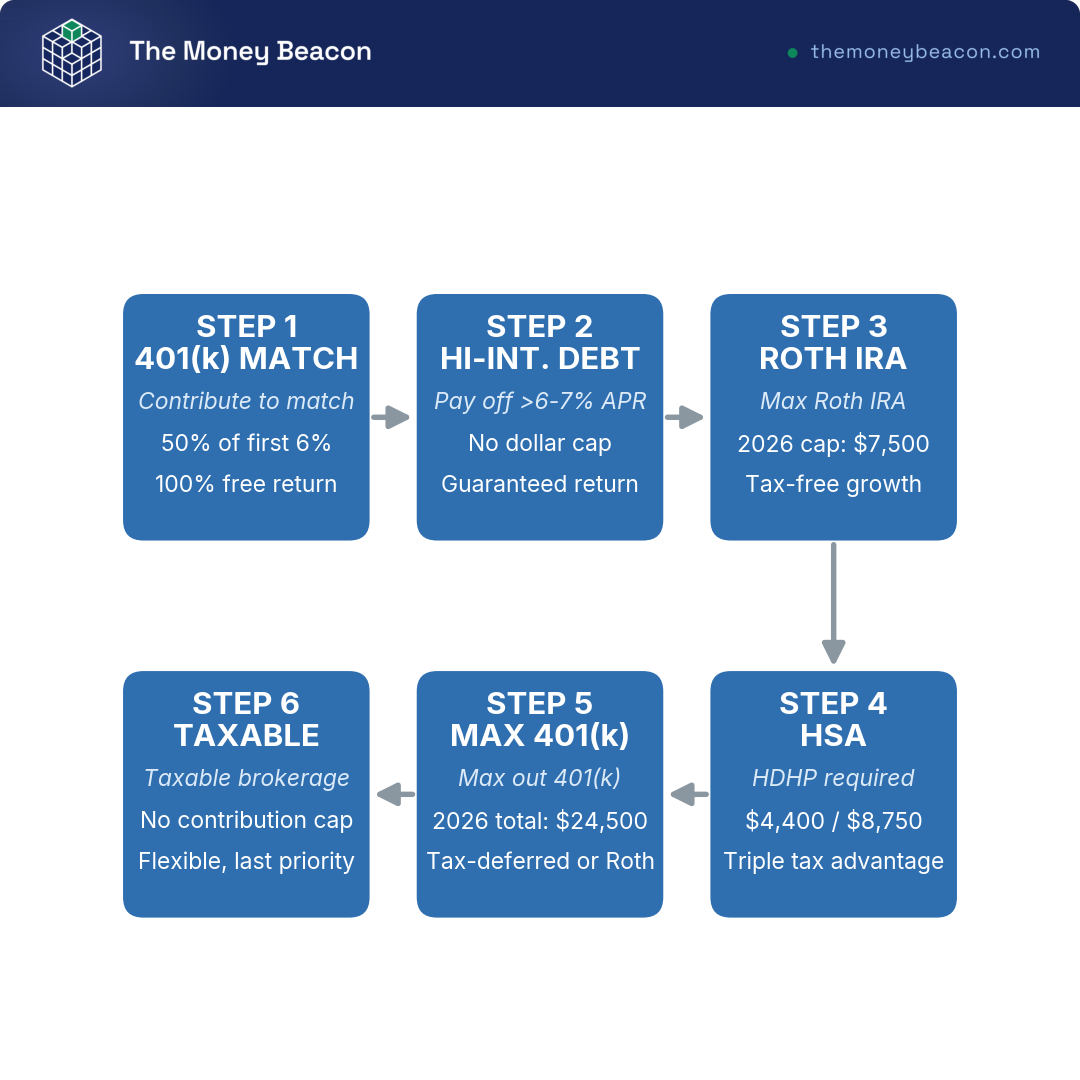
The flowchart shows the full ordered process, and the default bends in four common cases. If there is no match or no workplace plan, start the waterfall at step 3, the Roth IRA, then the HSA, then taxable, and consider a SEP or Solo 401(k) if you are self-employed. In a very high current bracket, favor the pre-tax (traditional) 401(k) to cut today’s tax bill, while still running the Roth IRA step through the backdoor. Planning to retire before 59 1/2? Overweight the taxable account and consider a Roth conversion ladder or a Rule 72(t) withdrawal to reach funds penalty-free, a drawdown tactic we return to later. And a worker with a governmental 457(b) can generally tap it without the 10% early-withdrawal penalty after leaving the job, which can reshuffle the order entirely.
Hank’s take
what the data shows on retirement saving is blunt: the order you fund accounts in moves your after-tax outcome more than picking this fund over that one. Sequencing is a lever almost entirely in your control, and the savers who get it right are not the ones who chased returns, they are the ones who captured the match and the tax breaks in the right order.
4. How Much to Save at Each Age
You now know the sequence for every dollar, but a perfectly ordered waterfall is useless if too little water is flowing through it. So the question shifts from where the money goes to how much of it there should be: will your current rate actually carry you to the target by the time you need it?
4.1 The Savings Rate Is the Lever That Matters
Most people chase the wrong thing. They hunt for the fund that returns 9% instead of 8%, when, with the real return held constant, your years to financial independence depend almost entirely on the share of income you save, not on which investment you pick. The reason is simple arithmetic: a higher rate both shrinks the spending you have to fund and grows the pile faster, so it works on both sides of the equation at once.
The numbers make the point better than any pep talk. The table below shows roughly how long it takes to reach about 25 times your spending at different savings rates, assuming a moderate real return and that your spending equals income minus savings.
| Savings rate (of gross) | Approx. years to ~25x spending |
|---|---|
| 10% | ~40+ years |
| 15% | ~30 to 35 years |
| 25% | ~25 years |
| 50% | ~15 to 17 years |
The investments inside the accounts still matter, of course, and low-cost index funds are the usual workhorse, a choice we lay out in our guide to low-cost index funds. But the rate is the lever you control directly, today, without forecasting a single market.
4.2 Benchmarks by Decade: 30s, 40s, 50s, 60s
Knowing that the rate matters most still leaves a fair question: at any given age, how much should already be sitting in the accounts? The most widely cited yardstick comes from Fidelity, which expresses the target as a multiple of your current salary at each decade. Here is the at-a-glance check.
| Age | Saved multiple of salary (rule of thumb) |
|---|---|
| 30 | ~1x |
| 40 | ~3x |
| 50 | ~6x |
| 60 | ~8x |
| 67 (retirement) | ~10x |
Data current as of June 2026.
Read this as a rule of thumb, not a personalized verdict. The multiple-of-salary guideline is a quick gut check, useful precisely because you can run it in your head, but it assumes a generic spending pattern and a standard retirement age. The 25x-of-spending method we built earlier is the sharper tool, because it ties the target to what you will actually spend rather than what you happen to earn. Use the multiple to spot whether you are roughly ahead or behind, then size your real number off spending. If you are a salaried worker watching your 401(k) balance climb, these checkpoints and the 12% to 15% rate are the two figures that frame whether you are on pace.
4.3 What Americans Have Actually Saved (Don’t Panic)
Those benchmarks can feel crushing if you are nowhere near them, so it helps to see what the country has actually banked. One measurement detail matters first: reported balances are heavily skewed, because a handful of very large accounts drag the average well above what a typical household holds. The median is the more honest mirror than the mean. The figures below come from the Federal Reserve’s Survey of Consumer Finances, the authoritative source on this question.
| Metric | Approx. figure | Note |
|---|---|---|
| Median retirement savings, near-retirees (55-64) | ~$185,000 | Federal Reserve Survey of Consumer Finances, 2022 |
| Mean (average) vs. median | Mean is multiples of median | Skew from high balances |
| Share of households with $1,000,000+ retirement savings | ~3-4% | Single-digit percent, SCF-based estimate |
| Top 1% retirement balance, age 60-64 | ~$3.55 million | SCF 2022 percentile threshold, not a target |
Data current as of June 2026.
So if your balance trails the benchmark, you are in the large majority, not the failing minority. Take that as reassurance, not a license to coast.
4.4 Starting Early vs. Catching Up Late
If the median is sobering, the good news is that time does most of the heavy lifting, provided you give it some. Compounding rewards early dollars so heavily that a worker who invests for about ten years and then stops can finish with more than someone who invests the same amount for thirty years but starts a decade later, when both earn around 7% and leave the money alone. The early contributions simply have more years to double and double again, and no later catch-up fully replaces that head start.
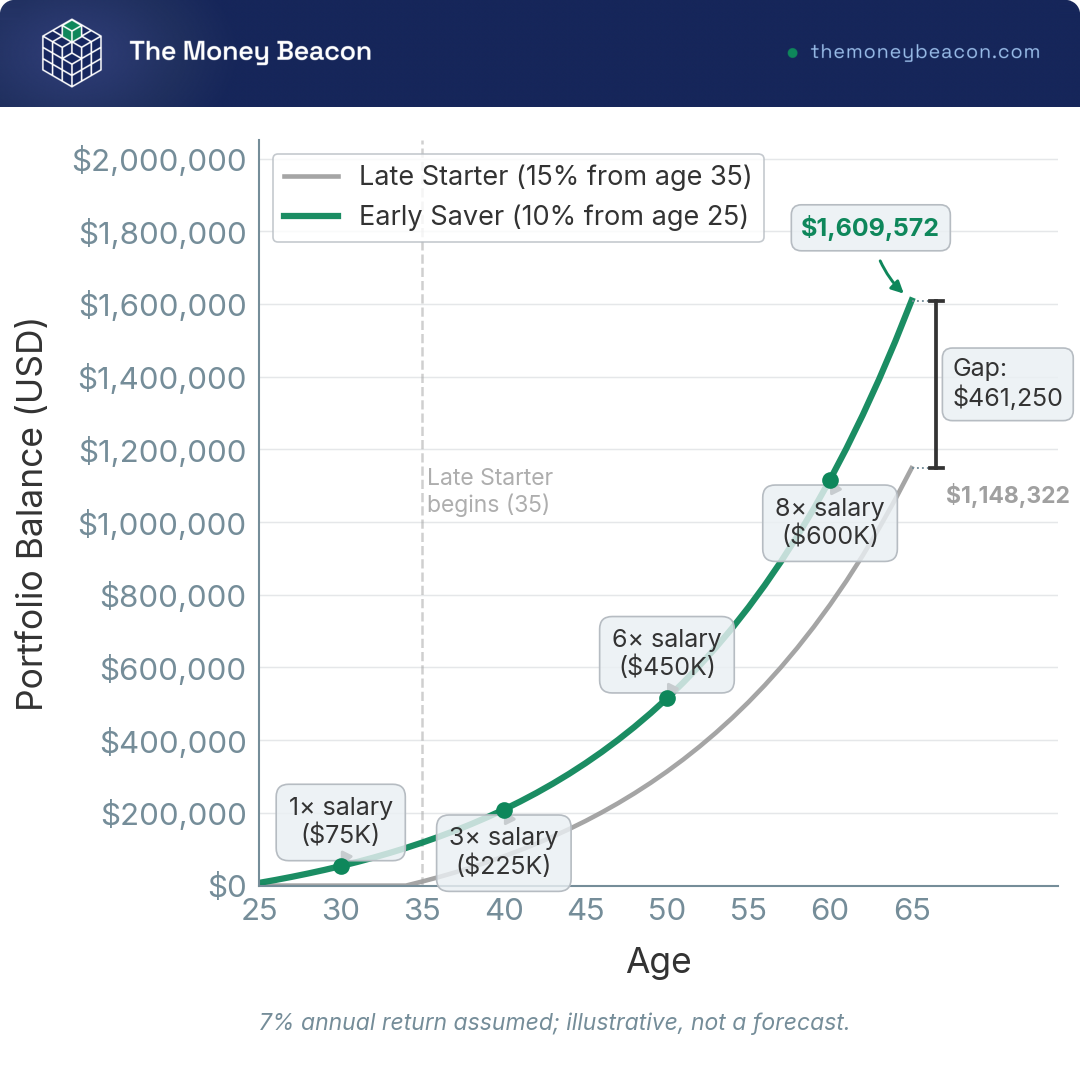
The chart traces an early saver putting away 10% from age 25 against a late starter saving a higher 15% from age 35, both at 7%, and the early saver still finishes ahead.
If you did start late, the situation is far from hopeless, because several levers stack together. The trick is to pull all of them at once rather than leaning on any single one.
- Capture every catch-up the law allows: an extra $8,000 in a 401(k) and $1,100 in an IRA at age 50 and up, rising to a $11,250 401(k) catch-up at ages 60 to 63.
- Push the savings rate well above 15%, since a late start needs a steeper rate to make up lost compounding.
- Work a few extra years, which both adds contributions and shortens the horizon the portfolio has to cover.
- Plan to delay Social Security, a lever we turn to next, because a larger guaranteed check shrinks how much the portfolio must produce.
None of this requires beating the market, only deciding to save more and, where possible, claim later. That last lever, when to start Social Security, is large enough to deserve its own section, because it can swing your guaranteed income by tens of percent for the rest of your life.
5. When and How to Claim Social Security
Social Security is the closest thing most retirees have to a guaranteed, inflation-adjusted paycheck, and the age at which you start it is a high-stakes, mostly irreversible choice. Get it right and you lean on a larger lifetime income; get it wrong and you permanently shrink the one benefit that lasts as long as you do.
5.1 How the Benefit Works and Claiming at 62 vs. FRA vs. 70
Before any claiming decision makes sense, you have to see how the check is calculated. The Social Security Administration indexes your lifetime earnings, then averages your highest 35 years (any missing years count as zeros) to produce your Average Indexed Monthly Earnings, or AIME. A progressive formula with bend points then converts that AIME into your Primary Insurance Amount (PIA), the benefit you would receive at full retirement age. For 2026, the formula credits 90% of AIME up to $1,286, then 32% between $1,286 and $7,749, and only 15% above $7,749, which is why each extra dollar of earnings adds less benefit as your income rises.
Your full retirement age (FRA) is 67 for anyone born in 1960 or later. The single most useful step you can take today is to pull your statement at ssa.gov through a my Social Security account; just know the estimate assumes you keep earning, so it overstates the benefit for someone who plans to stop working early. With the PIA in hand, the claiming trade-off comes into focus, and it is steep in both directions.
| Claim age | Benefit vs. FRA (FRA = 67) | Trade-off |
|---|---|---|
| 62 | 70% (-30%) | More years of checks, smaller each, lower survivor benefit |
| 67 (FRA) | 100% | Baseline |
| 70 | 124% (+24%) | Largest check and survivor benefit, but no checks from 67 to 70 |
Data current as of June 2026.
Claiming at the earliest age, 62, cuts your benefit by exactly 30% for life versus claiming at FRA. Wait past FRA and you earn delayed retirement credits of 8% a year up to age 70, with no further credit after that, which lifts the benefit to 124% of your PIA, a 24% raise over the FRA figure. One more rule bites if you claim early while still working: under the earnings test, benefits are temporarily withheld above $24,480 in 2026 (for a year fully below FRA) or $65,160 in the year you reach FRA, though those withheld dollars come back later as a higher benefit. The trade is essentially smaller checks for longer against larger checks for fewer years, which is precisely a longevity bet.
5.2 The Break-Even Math and Longevity
So does waiting actually pay, and for whom? Delaying trades cash in hand now for fatter checks later, so the real question is how long you have to live to come out ahead. The break-even age, where delaying to 70 overtakes claiming at 62 in cumulative dollars, lands around age 80, roughly 10.4 years after the larger delayed benefit begins. Live well past that point and the delay wins handily; die before it and the early claimer collected more.
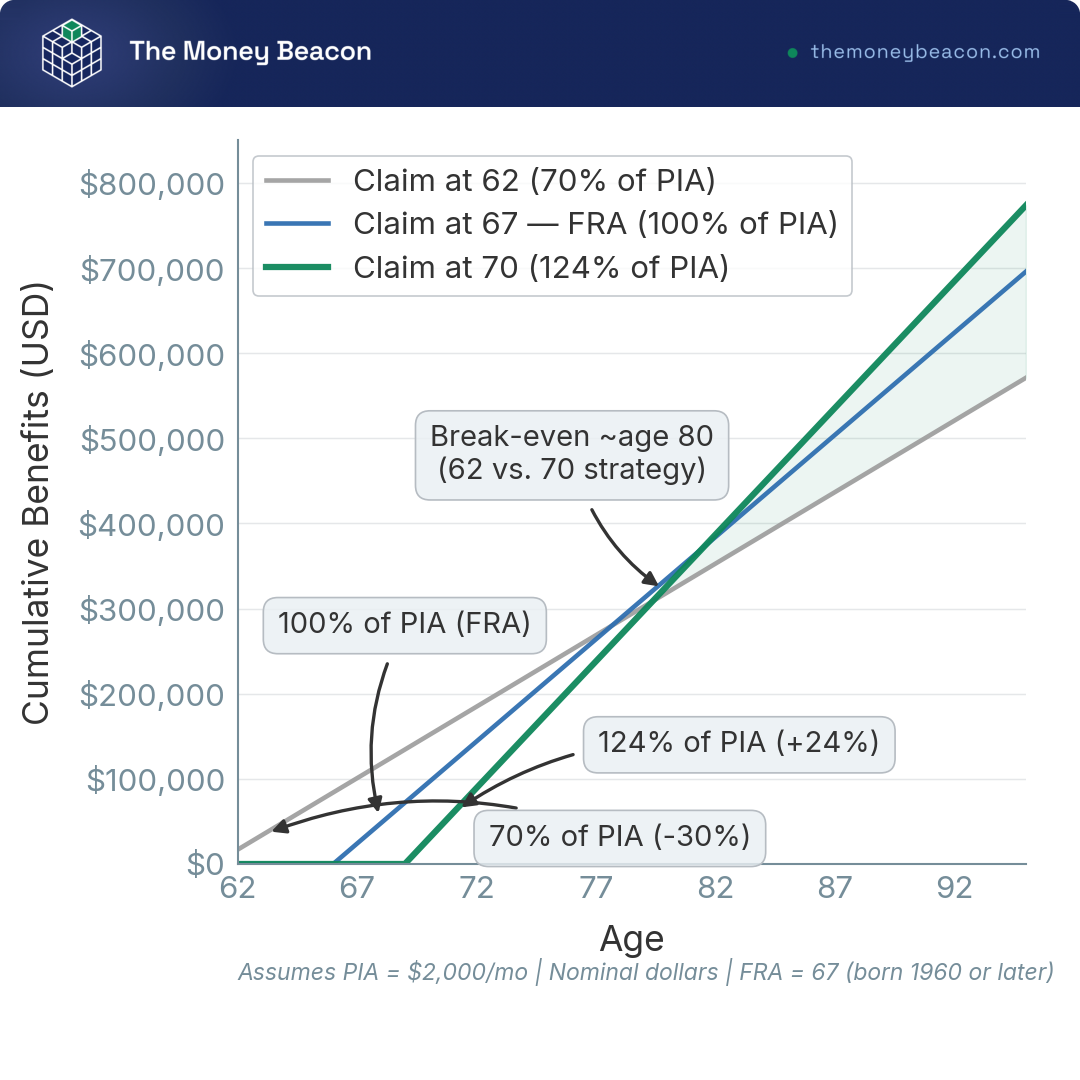
Delaying Social Security is the cheapest inflation-adjusted annuity you can buy, because nothing on the private market matches a guaranteed, cost-of-living-adjusted income stream for the price of waiting a few years.
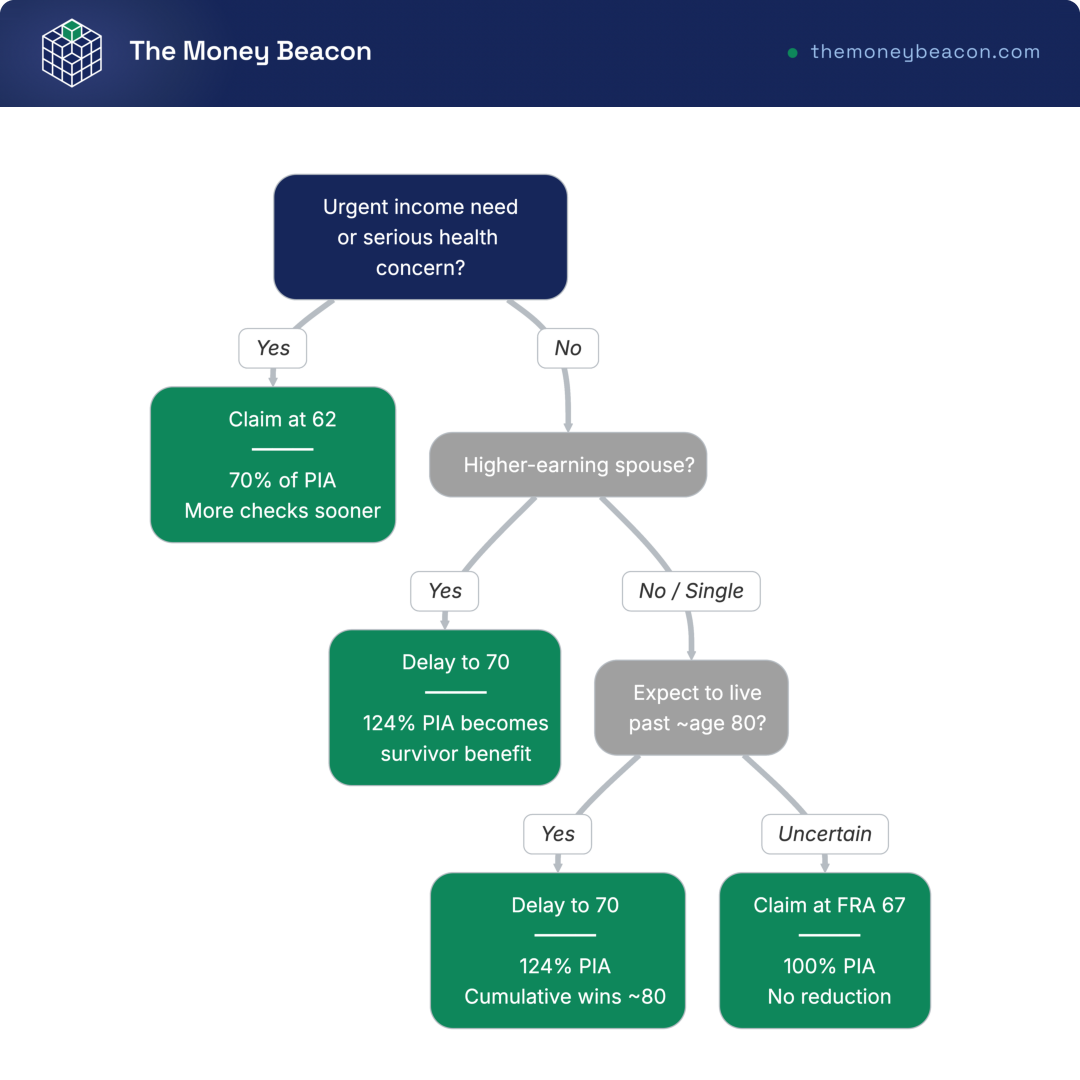
That frames a clean if-then rule. If you (or your spouse) expect to live past about 85, delaying toward 70 usually wins, both on cumulative dollars and on the inflation protection. If a serious health condition or an urgent need for income is in play, claiming earlier can be the right call instead.
Hank’s take
the behavioral-finance research is blunt about this: people anchor on getting their money as soon as possible and treat 62 as the default, when the longevity math says the patient choice is usually the better-paid one. The instinct to grab the check early is exactly the bias that quietly costs the long-lived retiree the most.
5.3 Spousal, Survivor, and the WEP/GPO Repeal
The claiming math gets higher-stakes once a spouse enters the picture, because two benefits are now in play instead of one. A lower-earning spouse can claim a spousal benefit of up to 50% of the higher earner’s PIA at full retirement age, less if claimed earlier. More consequential is the survivor benefit: when one spouse dies, the survivor can step up to 100% of the deceased’s benefit, delayed credits included. That single rule reshapes the whole decision for couples.
Here is the practical guidance that follows from it, and it is the mistake couples make most. If you are the higher-earning spouse, lean toward delaying, because your benefit sets the floor for the survivor benefit your partner may live on for years. The most expensive error is the higher earner claiming at 62, which permanently shrinks not just their own check but the survivor’s for the rest of their life. The decision tree below walks the choice through income need, health, marital status, and longevity.
A few rules round out the picture. The Social Security Fairness Act, signed January 5, 2025, repealed both the Windfall Elimination Provision and the Government Pension Offset, raising benefits for some workers with non-covered public pensions, and the SSA is recalculating affected checks. On taxes, up to 85% of your benefit can be federally taxable depending on your combined income, on thresholds that are not indexed to inflation, and some states tax benefits while most do not. When you are ready, you can apply up to four months before you want payments to start.
You now know your benefit, the three claiming ages, and how a couple coordinates them, which means you can size the guaranteed slice of your retirement income. What you do not yet have is the rest of the paycheck: how to combine that Social Security floor with your portfolio to produce reliable monthly income without running the accounts dry or overpaying tax. That is the decumulation problem, and it is where we head next.
6. Turning a Nest Egg Into Reliable Income
Saving for retirement and spending in retirement are two different problems, and the rules you spent decades learning flip the moment you stop earning a paycheck. With your Social Security floor sized, the job now is to turn the rest of the portfolio into a check that arrives every month without running the accounts dry or handing the IRS more than you owe.
6.1 Withdrawal Strategies: 4% Rule vs. Guardrails vs. Bucket
You already met the 4% rule in the first section as a way to size the target. Run it in reverse and it becomes a spending rule: withdraw 4% of the starting balance in year one, then adjust that dollar figure for inflation. The trouble is that it ignores the market entirely, so a retiree following it blindly can keep spending the same inflation-adjusted amount straight into a downturn. Two alternatives try to fix that, and each trades a little certainty for flexibility.
| Strategy | How it works | Strength | Weakness |
|---|---|---|---|
| Static 4% rule | 4% of starting balance, inflation-adjusted | Simple, predictable income | Ignores markets; can overspend in busts |
| Guardrails (dynamic) | Raise or cut spending when the withdrawal rate drifts past set bands (e.g., +/-20%) | Higher sustainable starting rate; adapts | Variable income year to year |
| Bucket approach | 1-2 years cash, mid bonds, long-term stocks; refill from gains | Behavioral cushion in downturns | Requires discipline to refill; not magic |
The guardrails method, developed by Jonathan Guyton and William Klinger in 2006, lets you start higher, often around 5% or more, on the deal that you trim spending in bad years and reward yourself in good ones. The bucket approach is more about psychology than math: keeping one to two years of spending in cash means you are never forced to sell stocks at the worst possible moment. None of the three is magic, and a fourth option, a guaranteed income floor, rounds out the picture in a chart you will see shortly. But before any of that, you need to know why the early years matter so much.
6.2 Sequence-of-Returns Risk in the First Decade
Here is the danger that makes a static 4% rule fragile. Sequence-of-returns risk is the threat that poor returns in the first few years of retirement, combined with the withdrawals you are taking, permanently shrink the portfolio even when the long-run average return turns out fine. The order of returns matters more than the average, which is the counterintuitive part: two retirees can earn the exact same average return over thirty years and end up with wildly different outcomes purely because one hit a bad stretch early and the other hit it late.
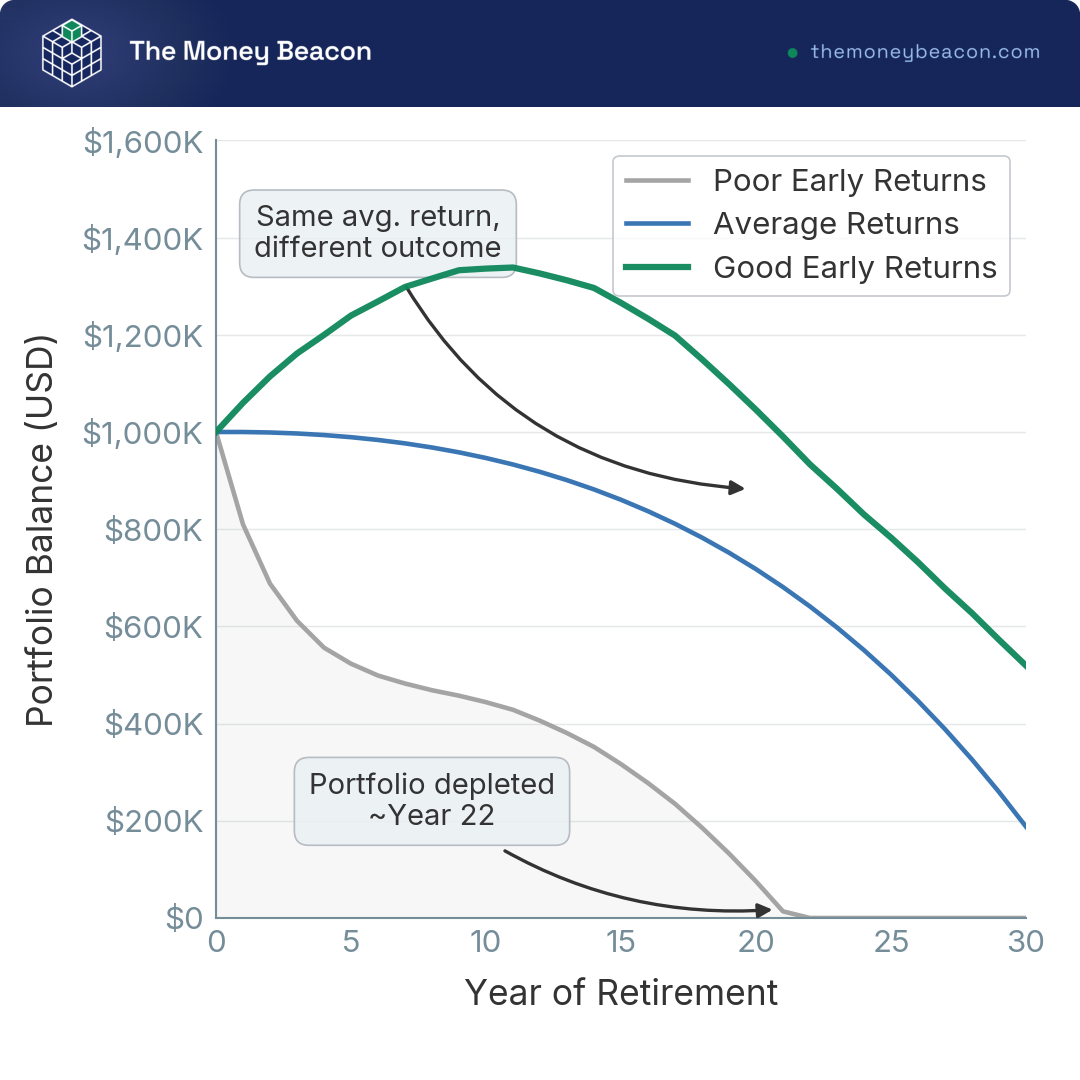
The chart starts three retirees at $1 million, each drawing 4%, and the only difference is the order of their returns. The one who meets a poor early sequence watches the portfolio drain by roughly year 22 to 25, while the others coast through three decades. When you sell shares to fund spending while prices are down, you lock in losses the market later recovers, and those sold shares never come back.
The good news is that the defenses are concrete, not mysterious. The single most useful habit is to keep one to three years of spending in cash or short-term bonds, so a downturn never forces you to sell stocks. Pair that buffer with a few other moves and you stack the protection.
- Hold one to three years of spending in cash or short bonds, and draw from it instead of stocks when markets fall.
- Use guardrails to cut spending in bad early years, easing the strain on the portfolio when it is most vulnerable.
- Delay Social Security where longevity favors it, since a larger guaranteed check means the portfolio carries less of the load early on.
- Keep a moderate allocation in the first decade rather than reaching for an ultra-aggressive mix right when sequence risk peaks.
Pulled together, those four moves turn the scariest decade of retirement into one you have planned for. The cleanest defense of all, though, is to make part of your income immune to the market in the first place.
6.3 Annuities and a Social Security Income Floor
If sequence risk is the problem, a guaranteed income floor is the most direct answer, because money that arrives no matter what the market does cannot be sequenced against you. A Single Premium Immediate Annuity (SPIA) converts a lump sum into a lifetime check and hands the longevity risk to the insurer; a deferred income annuity, sometimes called a QLAC, does the same thing but starts paying later in life. Both reduce sequence risk on the slice of essential spending they cover, though they come with real costs, illiquidity, and credit risk. If the insurer fails, your protection comes from state guaranty associations, not from FDIC or SIPC, so an annuity is never a deposit.
The smart framing treats Social Security as your inflation-adjusted floor first, because it is the cheapest guaranteed income you can buy and you already own it. A private annuity then fills only the gap between that floor and your essential spending, no more. As of June 2026, SPIA payout rates run roughly 5.25% to 7.65% on a $100,000 premium depending on age and term, and a stripped-down, low-cost SPIA can deliver on the order of 10% more income than a comparable indexed annuity loaded with riders. So buy the plain version and skip the bells.
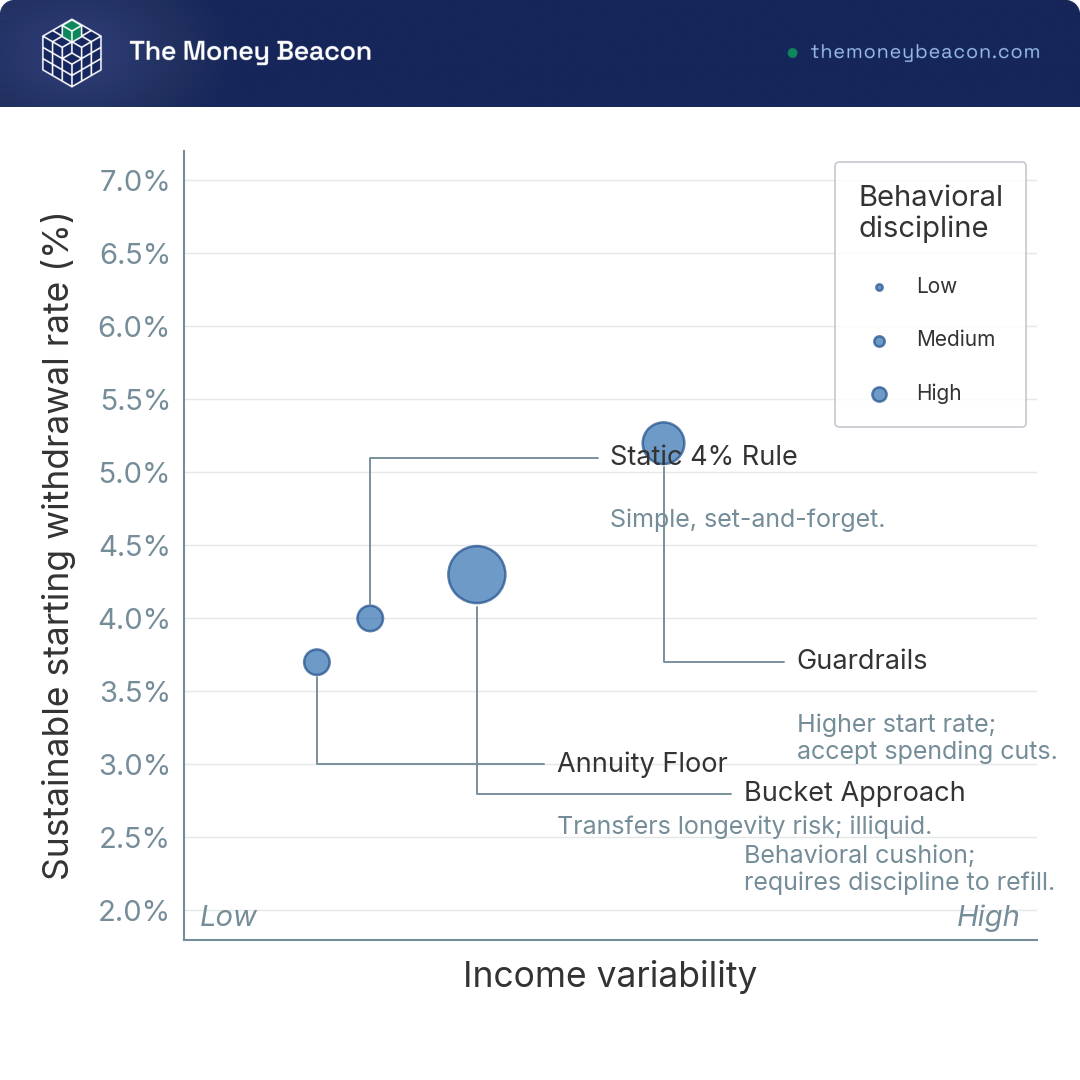
On that chart the annuity floor sits where income variability is lowest, which is exactly its job. With the income strategy chosen, one question remains: which account do you draw from, and in what order, to keep the tax bill low?
6.4 Tax-Efficient Withdrawal Order and RMDs
The order in which you tap accounts can change your lifetime tax bill by a meaningful margin. A common tax-efficient sequence is to spend the taxable account first, then the tax-deferred accounts (traditional 401(k) and IRA), and leave the Roth for last, so the tax-free money compounds as long as possible. The real opportunity hides in the low-income years right after you stop working but before Social Security and required withdrawals begin: those years are ideal for Roth conversions that fill up the low tax brackets, which smooths the lifetime bill and shrinks the future withdrawals the IRS will eventually force.
Those forced withdrawals are Required Minimum Distributions, and they set the clock. RMDs start at age 73 for anyone born between 1951 and 1959, then rise to 75 from January 1, 2033 for those born in 1960 or later. Roth IRAs carry no RMD for the original owner, and SECURE 2.0 eliminated lifetime RMDs on Roth 401(k) balances starting in 2024, which is one more reason to value Roth space. The amount itself is mechanical: divide your prior-year-end balance by the IRS Uniform Lifetime Table factor for your age, which is 26.5 at 73, or about 3.77% of the balance.
A worked example makes it more intuitive. A $500,000 traditional IRA at age 73 produces a first RMD of $500,000 divided by 26.5, or about $18,868; a $100,000 balance produces about $3,774. Miss the deadline and the penalty is steep: 25% of the shortfall, though that drops to 10% if you correct it within two years by filing Form 5329. The decision tree below sequences the annual choice, from the RMD you must take to the conversion you might want and the income thresholds worth watching.
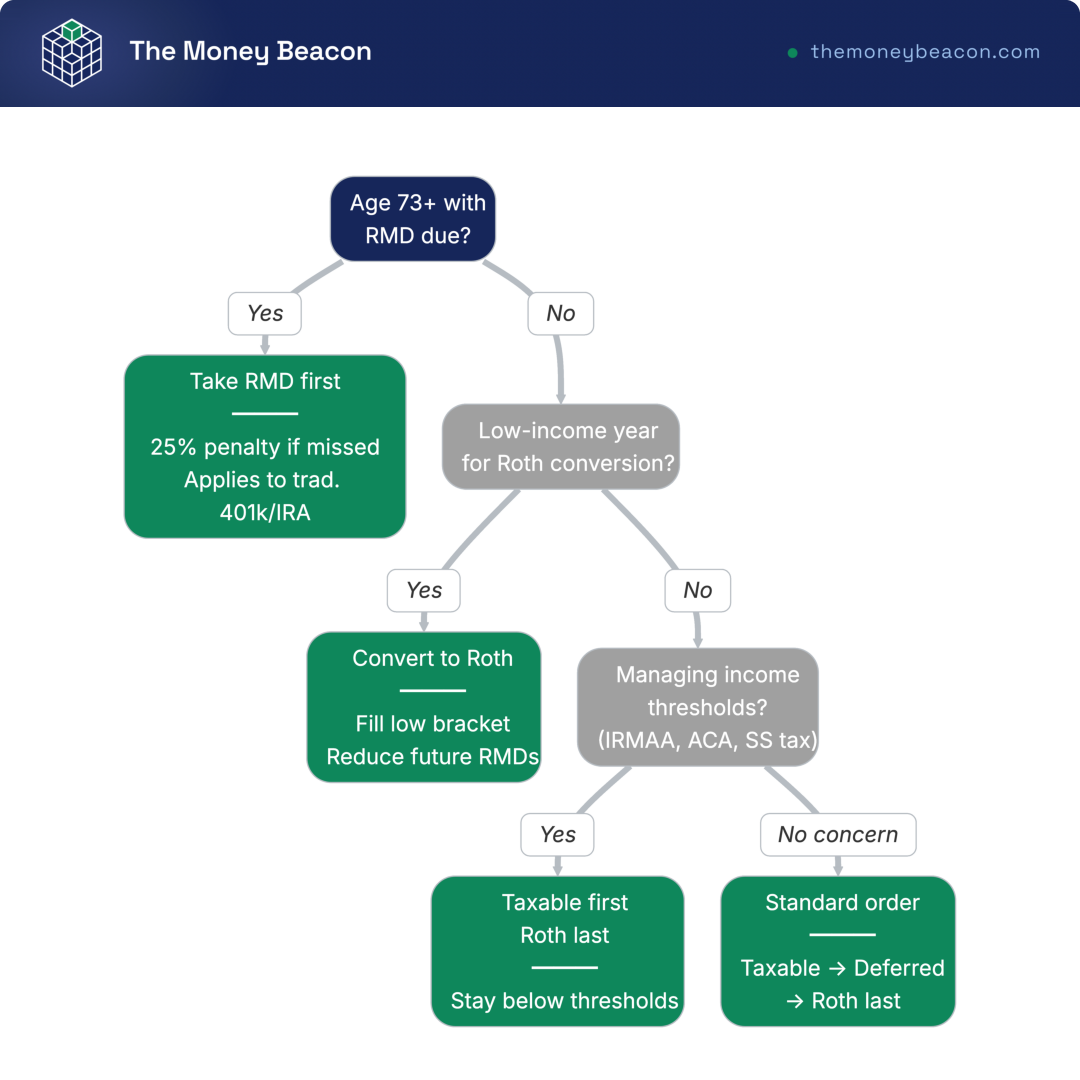
Where the drawdown order and conversions interact with capital-gains rates and asset placement, the details get richer, and we work through them in our guide to asset location and tax-loss harvesting. With the income engine built and the tax order set, every piece of the plan is now on the table, and the only thing left is to put them in sequence and avoid the errors that derail otherwise solid plans.
7. Putting the Plan Together and Avoiding Common Mistakes
You now hold every piece: the target, the accounts and their order, the savings rate by age, the claiming decision, and the drawdown method. What turns knowledge into a retirement is sequence, doing the right things in the right order and sidestepping the mistakes that quietly undo good intentions.
7.1 Your Step-by-Step Retirement Checklist
If you do nothing else with this guide, work this list from the top. Each step pairs the action to take with the single most common mistake at that stage, so you can see the trap as you clear it.
| Step | What to do | Common mistake to avoid |
|---|---|---|
| Size the target | Estimate annual spending, subtract Social Security, multiply the gap by 25 | Picking a round $1M or sizing off gross income instead of spending |
| Capture the match | Defer at least enough to get the full employer match | Deferring below the match and leaving free money behind |
| Build the order | Match, then Roth IRA, then HSA, then max the 401(k), then taxable | Skipping the HSA when you are HDHP-eligible |
| Hit the rate | Save about 12% to 15%+ including the match, and automate increases | Confusing account type with asset class |
| Invest inside | Use low-cost index or target-date funds inside the accounts | Sitting in cash inside a Roth for years |
| Claim Social Security | Decide on purpose and coordinate as a couple | The higher earner claiming early and shrinking the survivor benefit |
| Decumulate | Set a withdrawal method, hold a cash buffer, plan Roth conversions | Ignoring sequence risk |
| Manage RMDs | Calculate and take them by the deadline; consider QCDs | Forgetting RMDs spread across multiple IRAs |
The mistakes deserve a closer look, because the most expensive ones rarely feel like mistakes at the time.
7.2 The Mistakes That Wreck Retirements
Most retirements are not wrecked by a market crash; they are wrecked by a handful of avoidable errors that compound quietly for years. The costliest ones are worth naming plainly so you can spot them in your own plan.
- Confusing the account with the asset class: holding a Roth in cash for a decade wastes the most valuable tax shelter you have.
- Leaving the match unclaimed: the most expensive avoidable mistake early in a career, since it forfeits a guaranteed return.
- Claiming Social Security by default at 62 without running the longevity and survivor math.
- Ignoring sequence risk: with no cash buffer, a downturn forces you to sell stocks at the worst possible time.
- Overpaying for advice or products: a 1% AUM fee on a $1 million portfolio is $10,000 a year, roughly 0.5 to 1 percentage point off a safe withdrawal rate, and high-fee variable annuities pile on top of that drag.
- Missing RMDs or botching the pro-rata rule on a backdoor Roth.
- Treating brokerage assets as FDIC-insured when they are not; SIPC covers broker failure, not market losses.
Several of those errors are tied to a specific age, which is why a simple timeline helps you see them coming rather than discovering them late.
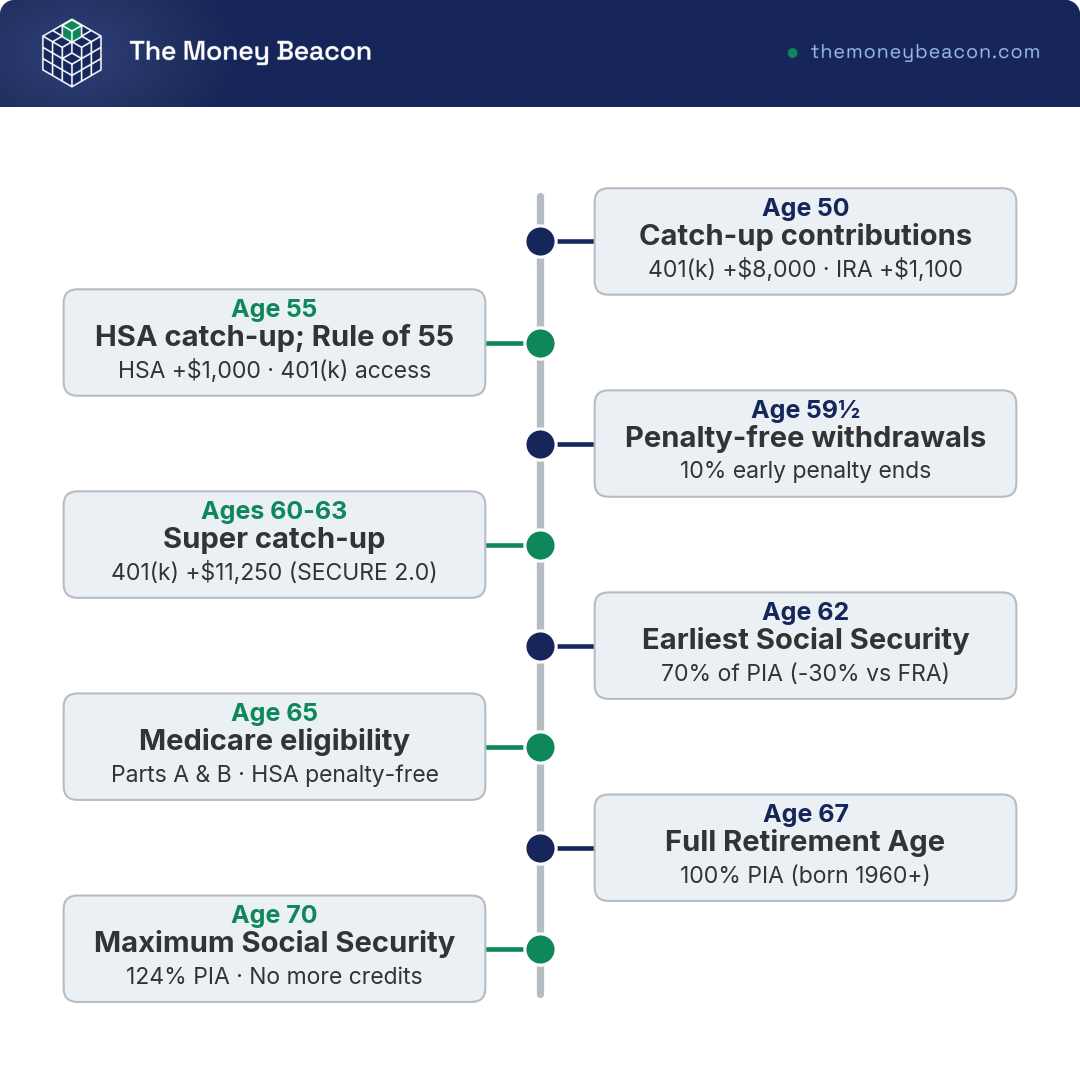
The timeline marks the deadlines that sneak up: catch-up eligibility at 50, penalty-free withdrawals at 59 1/2, the earliest Social Security claim at 62, Medicare at 65, full retirement age at 67, the maximum benefit at 70, and the RMD start at 73. Knowing what is coming next is half the battle. The other half is deciding how much of this you want to handle yourself.
7.3 DIY vs. Robo-Advisor vs. Fee-Only Human Advisor
Once you know the tasks the plan demands, you can judge honestly whether they exceed your confidence or your time. The choice usually comes down to three options that differ sharply on cost and on the kind of saver they fit.
| Option | Typical cost (2026) | Best for |
|---|---|---|
| DIY (index or target-date funds at Fidelity, Vanguard, or Schwab) | Fund expense ratios only, often 0.03% to 0.15% | Confident savers with simple situations |
| Robo-advisor (Betterment, Wealthfront, Schwab Intelligent Portfolios) | About 0.25% a year | Hands-off savers who want automation |
| Fee-only fiduciary advisor / RIA | About 1% of assets, or flat/hourly ($200 to $400/hr) | Complex situations, decumulation, behavioral coaching |
Data current as of June 2026.
The pattern is straightforward: you pay more as the work gets more personal. A fee-only advisor earns the fee at genuine transitions, such as sequencing your drawdown, timing Roth conversions, and coordinating Social Security, or when a behavioral mistake like panic-selling would cost more than the fee itself. If you lean toward automation instead, our comparison of top robo-advisors for hands-off investing lays out the field. One warning matters most before you sign anything: verify the fee-only label, which is not the same as “fee-based,” a term that can include commissions, and check the adviser’s record on NAPFA, the SEC (Securities and Exchange Commission) and FINRA (Financial Industry Regulatory Authority) databases, and Form ADV. If you want a walk-through of how to vet a fiduciary and what one should cost, our guide to finding a fee-only fiduciary advisor covers it in full.
7.4 The Whole Plan in One Table
Every concept in this guide now has its place, which means a single table can finally hold the whole plan without losing anything. This is the one-screen recap, the four retirement questions answered with the figures that anchor each, plus the mistake most likely to undo it.
| The four questions | The answer | Key 2026 figures | Most common mistake |
|---|---|---|---|
| How much? | Annual spending minus Social Security, times 25 (the 4% rule) | A $60k gap means a ~$1.5M target | Sizing off income, not spending |
| Which accounts, in what order? | Match, then Roth IRA, then HSA, then max 401(k), then taxable | 401(k) $24,500; IRA $7,500; HSA $4,400/$8,750 | Skipping the match or the HSA |
| How much per age? | A ~12% to 15% savings rate; ~1x salary by 30, 3x by 40, 6x by 50, 8x by 60, 10x by 67 | Catch-up at 50+: +$8,000 (401k), +$1,100 (IRA) | Investing focus over savings rate |
| When to claim Social Security? | On purpose: 62 = -30%, 70 = +24% vs. FRA 67; delay if longevity or a survivor favors it | FRA 67 (born 1960+); +8%/yr to 70 | Defaulting to 62 |
| Turn it into income | Cash buffer plus a withdrawal method; Social Security as the floor; tax-smart drawdown; RMDs at 73 | RMD on $500k at 73 is about $18,868 | Ignoring sequence risk and RMDs |
Data current as of June 2026.
Every figure here ties back to irs.gov and ssa.gov for 2026. The plan is no longer abstract; it is a sequence of decisions you can start making this week.
Conclusion
Retirement planning shrinks to four answerable questions once you stop staring at the round numbers other people fear. Size the target off what you will actually spend, multiply the gap by 25, fund your accounts in order from the employer match down to the taxable brokerage, and aim for a savings rate near 12% to 15% rather than the perfect fund. Two things are worth remembering. The order in which you fund and later drain your accounts moves your after-tax outcome more than almost any investment pick, which is why the low-income years before age 73 are prime Roth-conversion territory. And the survivor benefit is the rule couples overlook most: a higher earner who claims at 62 permanently shrinks the check a spouse may live on for years.
The natural next step is the tax side of drawdown, where asset location and the order you tap accounts decide your lifetime bill, and you can dig into that in our guide to capital gains and tax-loss harvesting. If you would rather pressure-test the Roth versus traditional bet for your own bracket, our guide to every Roth IRA rule and the backdoor route runs the cases, and for those weighing how much help the decumulation phase warrants, our guide to finding a fee-only fiduciary advisor covers what one should cost and how to vet the label.
Frequently Asked Questions
How much money do I actually need to retire?
Start with spending, not a round number. Estimate your annual retirement spending, subtract guaranteed income (Social Security, any pension), and multiply the remaining gap by 25. A household spending $60,000 a year beyond Social Security needs roughly $1.5 million. Use 25x as a first pass; tighten toward 30-33x (a 3-3.3% rate) for a long early-retirement horizon, or accept 20-25x if you plan to adjust spending in bad years. The most common sizing mistake is working backward from gross income rather than actual spending, which sets a target that is almost always too high.
What is the 4% rule, and is it still safe?
The 4% rule, introduced by William Bengen in the Journal of Financial Planning in October 1994 and validated by the Trinity study in 1998, says you can withdraw 4% of your starting portfolio in year one, then adjust that dollar amount for inflation each year. Historically, a 50/50 stock-bond portfolio survived 30 years in about 95% of rolling US periods going back to 1926. The rule remains a reasonable baseline, but it is sensitive to your time horizon, fees, and starting market conditions. Cautious analyses, including Schwab’s research, point to roughly 3-3.5% for a 40-to-50-year horizon, while Bengen’s updated work defends a starting rate of 4.2-4.3% and up to 4.7% under a more diversified mix. With dynamic guardrails, where you cut spending in bad years and raise it in good ones, a higher starting rate is also defensible.
In what order should I fund my 401(k), IRA, HSA, and brokerage account?
Capture the full employer match first, because it is an instant 50-100% return and nothing else in the plan reliably beats it. After that, max a Roth IRA ($7,500 in 2026), then max a health savings account, or HSA ($4,400 self-only or $8,750 family), if you are enrolled in a high-deductible health plan; the HSA is the only triple-tax-advantaged account available. Then finish maxing the 401(k) ($24,500), and use a taxable brokerage for everything beyond that. High earners above the Roth income phase-out ($153,000-$168,000 single, $242,000-$252,000 married filing jointly in 2026) can still fund a Roth through a backdoor Roth conversion; the self-employed substitute a SEP IRA or Solo 401(k) in place of the workplace plan. For a deeper look at how the 401(k) works within this order, our complete 401(k) guide covers the match mechanics, the 2026 limits, and the traditional versus Roth decision in full.
How much should I have saved for retirement by my age?
A widely used rule of thumb, published by Fidelity, targets roughly 1x your salary saved by 30, 3x by 40, 6x by 50, 8x by 60, and 10x by 67. These are benchmarks, not personalized targets; the 25x-of-spending method is more precise and far more useful. The reality check is sobering: the median retirement balance for near-retirees aged 55-64 sits around $185,000, according to the Federal Reserve Survey of Consumer Finances, a fraction of any 8-10x salary guideline. Reported averages are meaningfully higher because a small number of very large accounts skew the mean upward, so the median is the more honest mirror. If you are behind the benchmarks, the savings rate is the lever you control, not the stock market.
Should I claim Social Security at 62, full retirement age, or 70?
The answer depends on longevity, marital status, and income need, and it is worth making this decision deliberately rather than by default. Claiming at 62 cuts your benefit exactly 30% versus a full retirement age of 67 for anyone born in 1960 or later. Delaying past full retirement age earns delayed retirement credits of 8% per year, so claiming at 70 raises the benefit to 124% of your Primary Insurance Amount, a 24% increase. The break-even age, where cumulative lifetime dollars from delaying to 70 overtake cumulative dollars from claiming at 62, is around age 80. If you or your spouse expect to live past roughly 85, delaying toward 70 usually wins; if a serious health condition or urgent income need is in the picture, claiming earlier can be the right call. For married couples, the higher earner claiming early is the single most common mistake, because your benefit becomes the survivor benefit the surviving spouse keeps for life.
How do I turn my retirement savings into monthly income?
Pick a withdrawal method first. The static 4% rule offers predictability but ignores what markets are doing; dynamic guardrails, which raise or cut spending when your withdrawal rate drifts past set bands, can support a higher starting rate; and the bucket approach holds 1-2 years of spending in cash, a mid-term bond sleeve, and long-term stocks, giving you a behavioral buffer when markets fall. Whichever method you choose, treat Social Security as your inflation-adjusted income floor, the cheapest guaranteed annuity available, and hold 1-3 years of spending in cash to avoid selling stocks in the first decade when sequence-of-returns risk is highest. Draw from accounts in tax-efficient order: taxable first, then tax-deferred accounts like your traditional 401(k) or IRA, then Roth last. Use low-income years before Social Security and required minimum distributions (RMDs) begin to do Roth conversions and smooth your lifetime tax bill. RMDs start at age 73 under current law for those born between 1951 and 1959, rising to age 75 starting January 1, 2033, for those born in 1960 or later. On a $500,000 balance at 73, the first RMD works out to about $18,868. Our Roth IRA guide covers the conversion mechanics and the five-year rule in detail if you want to build that part of the drawdown plan.



Comments
Questions and corrections welcome. We read everything.